


Top-10 Test 8: Mass Airflow Sensor
Test 8: Mass Airflow Sensor
The purpose of this test is to evaluate the voltage output and response time of the Air Flow Meter (AFM) during engine idle, Wide open Throttle (WOT) and over-run conditions.
How to perform the test
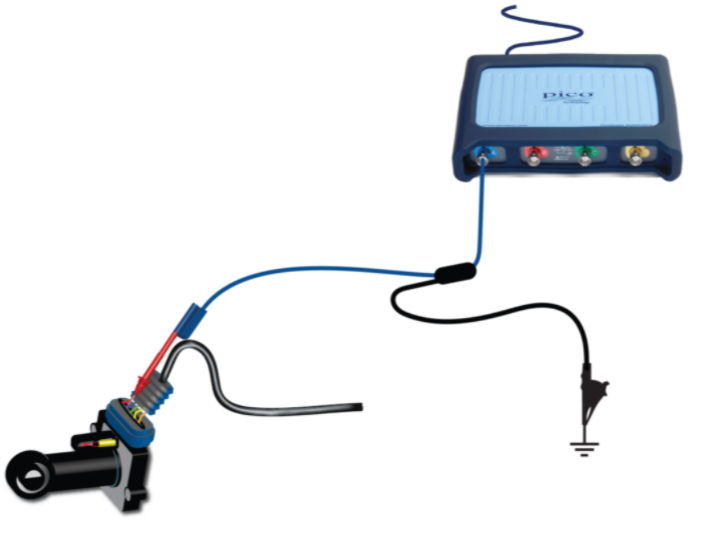
- Use the manufacturer's data to identify the AFM sensor signal circuit;
- Connect the PicoSCope Channel A to the sensor's signal circuit;
- Use a guided test to retrieve guidance and to set up the PicoScope for you:
- Click on Guided tests in PicoScope 7 to open the Guided Tests Window;
- Click the red Sensors icon;
- Choose Air flow/Mass
- Select Air flow meter (hot wire, gasoline)
- Click the Guide and settings file button;
- The PicoScope will be set up for you, an example waveform will be loaded, and the test guide will be displayed.
- Start the engine;
- Start the scope to see live data;
- Carry out a wide open throttle (WOT) test;
- With your waveform on the screen, stop the scope;
- Use the Waveform Buffer, zoom, and Measurement to examine your waveform.
Waveform Analysis
When the engine is idling, the voltage is about 500 mV. Depress the accelerator (WOT), and the voltage rises rapidly to about 4 V because of the increased airflow. When the accelerator is released, the voltage is reduced rapidly again. As the engine overruns, the airflow and hence the voltage will reduce gradually. Some ECUs will maintain limited airflow or even increase it during overrun as an anti-stall feature.
The hash (noise) on the waveform is largely due to engine ignition pulses.
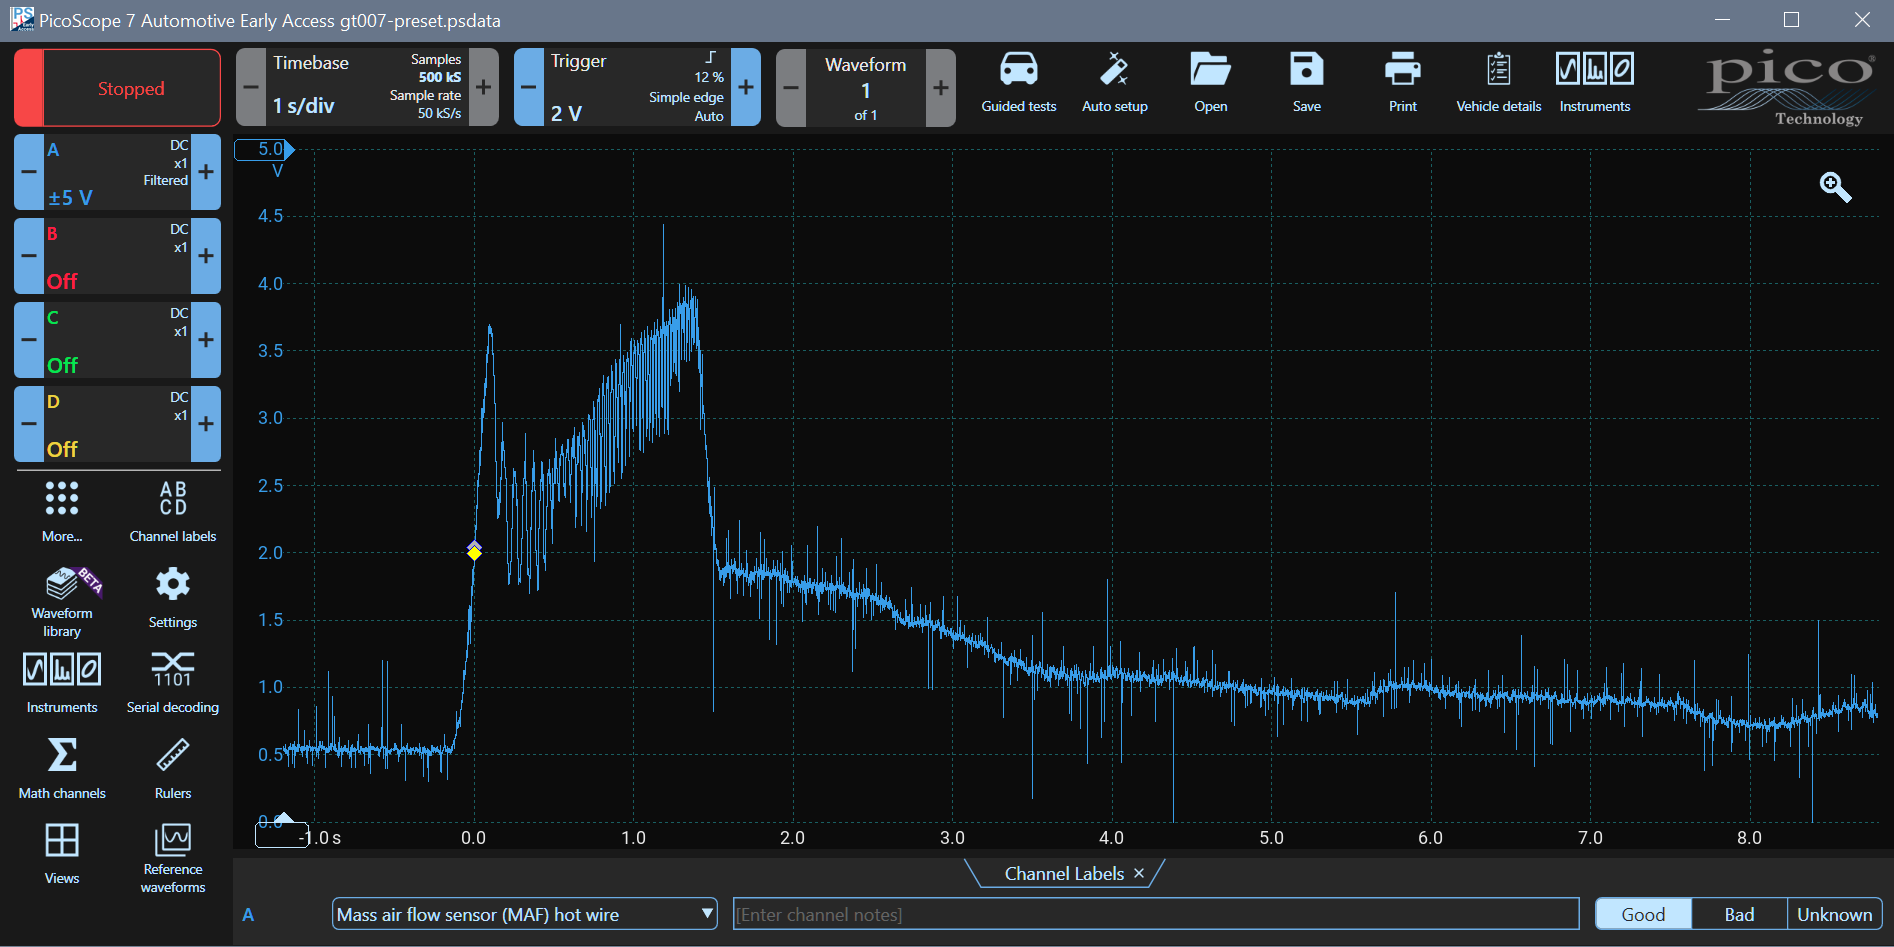
Notice that Channel A has been filtered. A 20 kHz hardware low-pass filter has been applied to limit signal noise. This filter (unlike a DSP filter - see below) filters out high frequencies using hardware, and the high frequencies are not stored.
Applying a DSP filter to clean up the signal
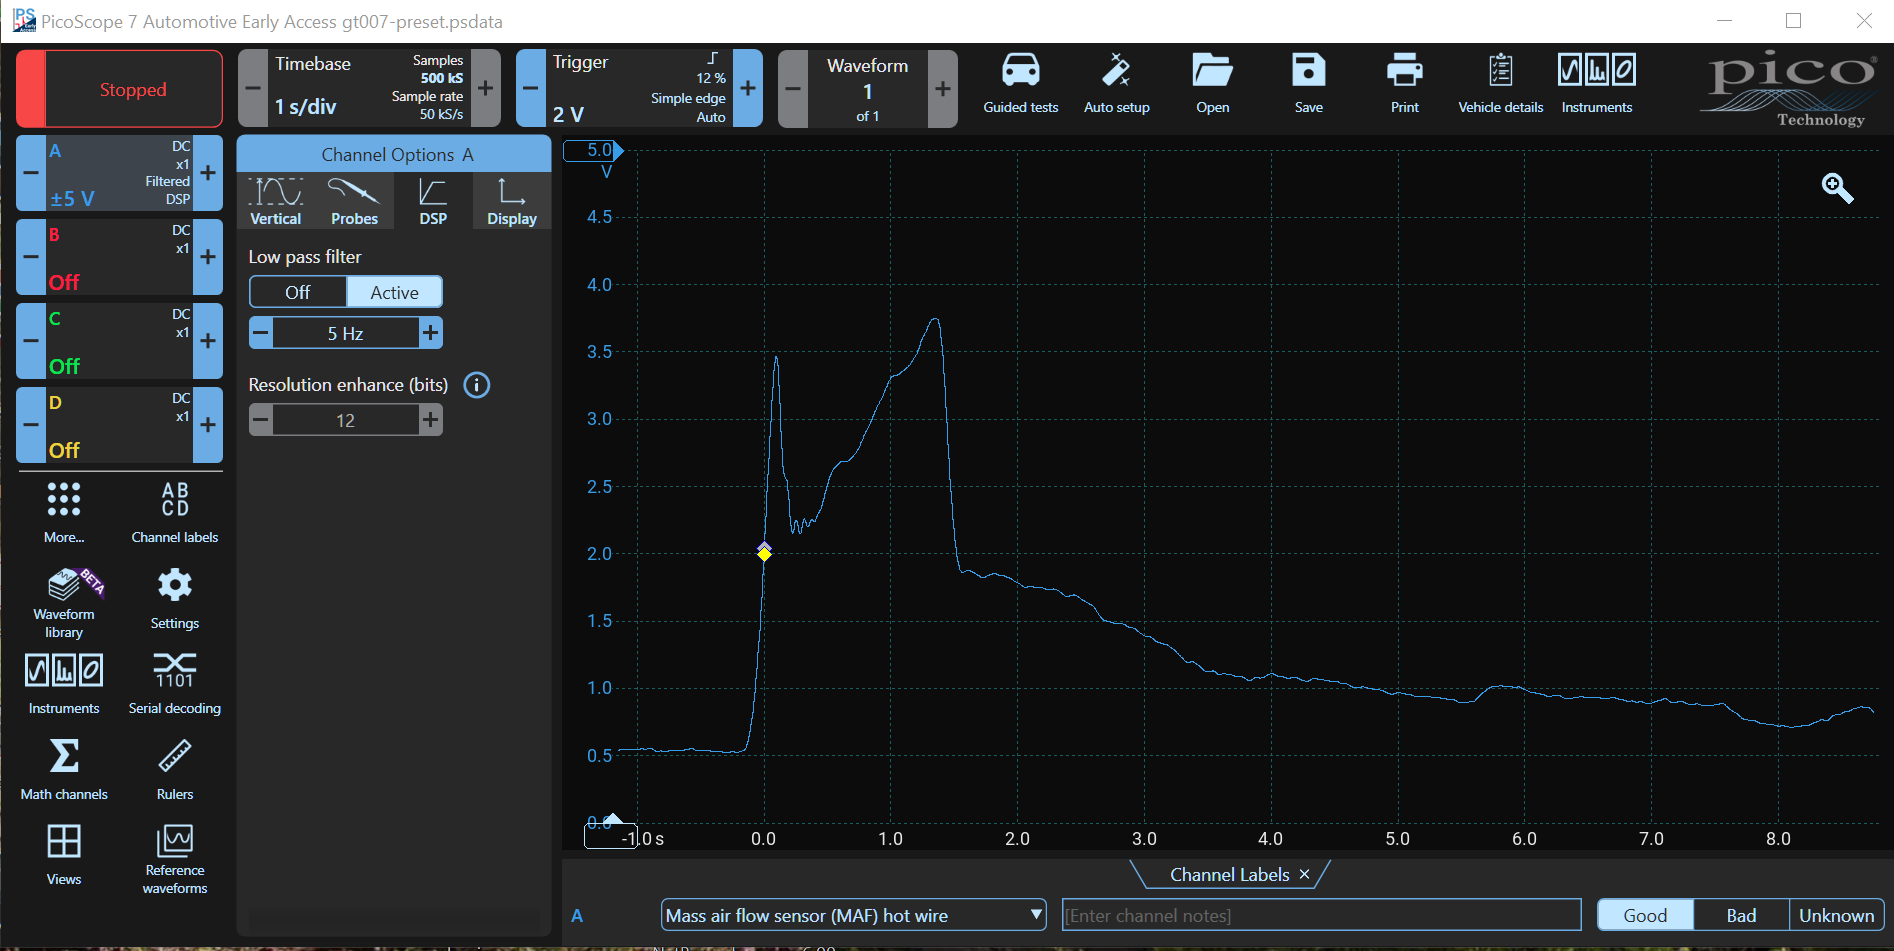
Unlike the hardware filter, the PicoScope DSP filters are applied to the waveform after capture, which means that all data is captured and the display is updated by the filter. No data is lost by the application of a DSP filter.
Click on Channel A
You will notice that Bandwidth Limit (Hardware Filter) is set to 20 kHz. Switching it on and off does not change the displayed signal.
Select DSP at the top. Set the Low pass filter to Active and then reduce the frequency progressively, down to about 5 Hz and see how the displayed signal changes. The high-frequency noise on the signal is reduced. Over-filtering can remove important detail, so be careful when applying filtering.
Switching the Low pass filter off restores the original signal.
Vane Airflow Meter Guided Test
The purpose of this test on a Porsche 944 is to evaluate the voltage output from the internal track of the air flow meter during engine idle, Wide Open Throttle (WOT) and over-run conditions. The waveform library and guided tests are introduced.
Diesel Hot Film Airflow Meter Guided Test
The purpose of this test is to evaluate a hot film Air Flow Meter's (AFM) voltage output with a turbo-diesel engine during engine idle, acceleration, and over-run conditions. The waveform buffer is used to go back to the waveform of interest.
Digital Air Flow Sensor
Frank Massey looks at converting a digital air mass (frequency output) value to an analogue value. He discusses the theory of the test, what is being tested and the simplicity of using a scope for this test. He covers time-bases, current and voltage ranges, and of course, the physical connections required.
One of the features of the Automotive Oscilloscope is a frequency counter on its input. The frequency of the input signal can be displayed directly. Note: frequency can also be determined using a Math Channel, and this can be done across multiple channels.
Frank also made an interesting discovery that the current consumption of the digital air-flow sensor seems to follow the frequency output.