


Top-10 Test 9: CAN Bus
Test 9: CAN Bus
The purpose of this test is to determine the physical integrity of a Controller Area network (CAN) bus by checking the CAN-High and CAN-Low line voltages.
Please note that you don't need a PicoScope to examine and process the sample waveforms. Download the free software. You will not be able to connect to a vehicle without a scope, but you can load the Guided Test, examine the sample waveform, and process it using the math channel.
Network Protocols
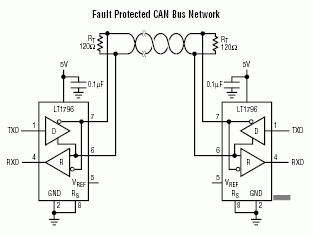
There are a number of different network protocols used in vehicles. These include CAN, CAN-FD, Flexray, and LIN, among others. The PicoScope can be used with all of these. There are also different CAN standards — occasionally different voltages are used (e.g. on Low Speed, CAN-Networks), and there is even a single-ended (one wire) version. The vast majority, however, use a 2-wire, differential twisted pair as described below.
How to perform the CAN Bus Test
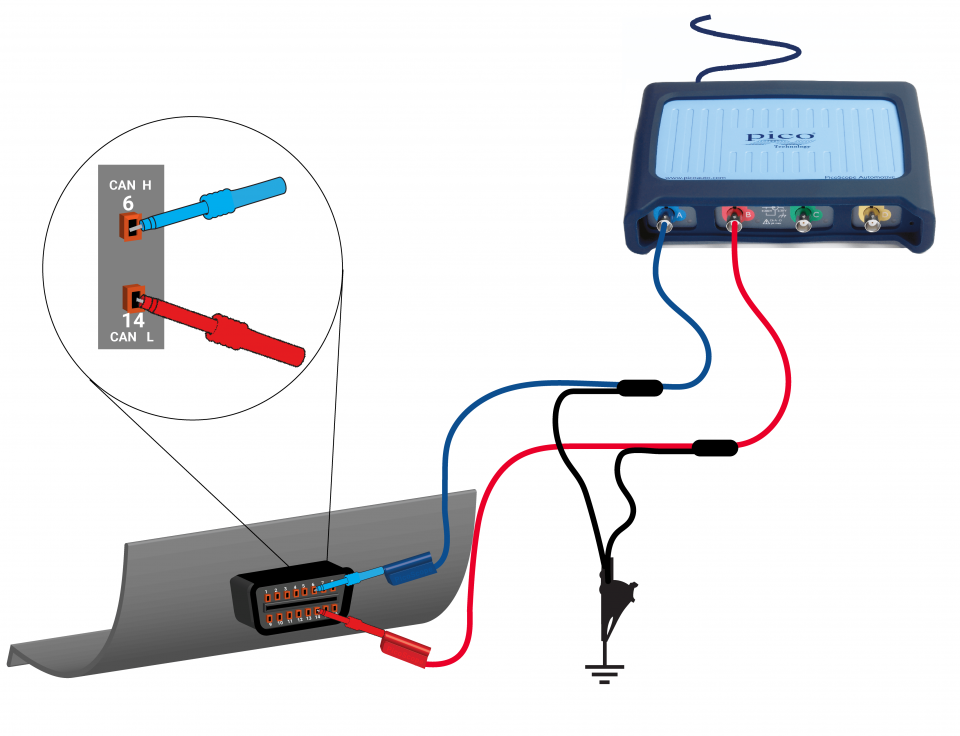
- Locate the Diagnostic Link Connector (DLC). This connector is also known as the DLC or OBD connector and is
usually found under the dashboard near to the steering wheel. It is the connector used to connect scan tools to
the vehicle;
- The DLC on some vehicles only connects to a gateway. You may need to connect to the High-Speed CAN-networks, elsewhere in the vehicle. See the video by Barnaby, below and the manufacturer's data for guidance;
- If you have a PICO-PP619 CAN Break Out Box, you can use it to make connections more easily; otherwise, back-pinning probes should be used to make the connection;
- Connect PicoScope Channel A to Terminal 6 (CAN-H)
- Connect PicoScope Channel B to Terminal 14 (CAN-L)
- For best results, consider using two PICO-TA499 PICO-BNC+ 10:1 Scope Probes or PICO-TA375 BNC Scope Probes set on 10:1, as these are capable of higher frequencies and do not load the network like standard test leads. These are optional for CAN but should always be used when testing high-frequency signals like Flexray.
- You can use a Guided Test to retrieve further information about the test and to set up the PicoScope for you:
- Using PicoScope 7, click on Guided Tests to display the Guided Tests Window;
- Click the Purple Communications Icon;
- Choose CAN Bus;
- Select CAN Bus Physical Layer;
- Click the Guide and Settings File Button;
- The CAN bus physical layer guide will be loaded, and the scope will be set up with a sample CAN waveform.
- Start the scope to see live data
- Turn ignition on, and you can start the engine if necessary;
- With the live waveform on the screen, stop the scope;
- Turn the ignition off;
- Use the waveform buffer, zoom, and measurements to examine your waveform.
CAN Bus Testing Guide
Pico's Barnaby Donohew takes us through the PicoScope Automotive Guided Test for the CANBus physical layer. From opening the Guided Test (GT126) within PicoScope to connecting the scope to the vehicle, taking your capture, and then interrogating that capture.
Most vehicles have more than one network. Some are low speed, others are high speed, and they are not connected. They use 'gateway' ECUs that act as bridges between them. The DLC might not be connected to the high-speed CAN network, as Barnaby explains in this video.
The presence of multiple CAN Networks, means that you may have to test it multiple times in different places.
As Barnaby points out in his video, the higher amplitude of the final bit in the message (ACK) is because many receivers respond simultaneously.
Understanding the Captured Waveform
Most CAN Bus waveforms have the following characteristics:
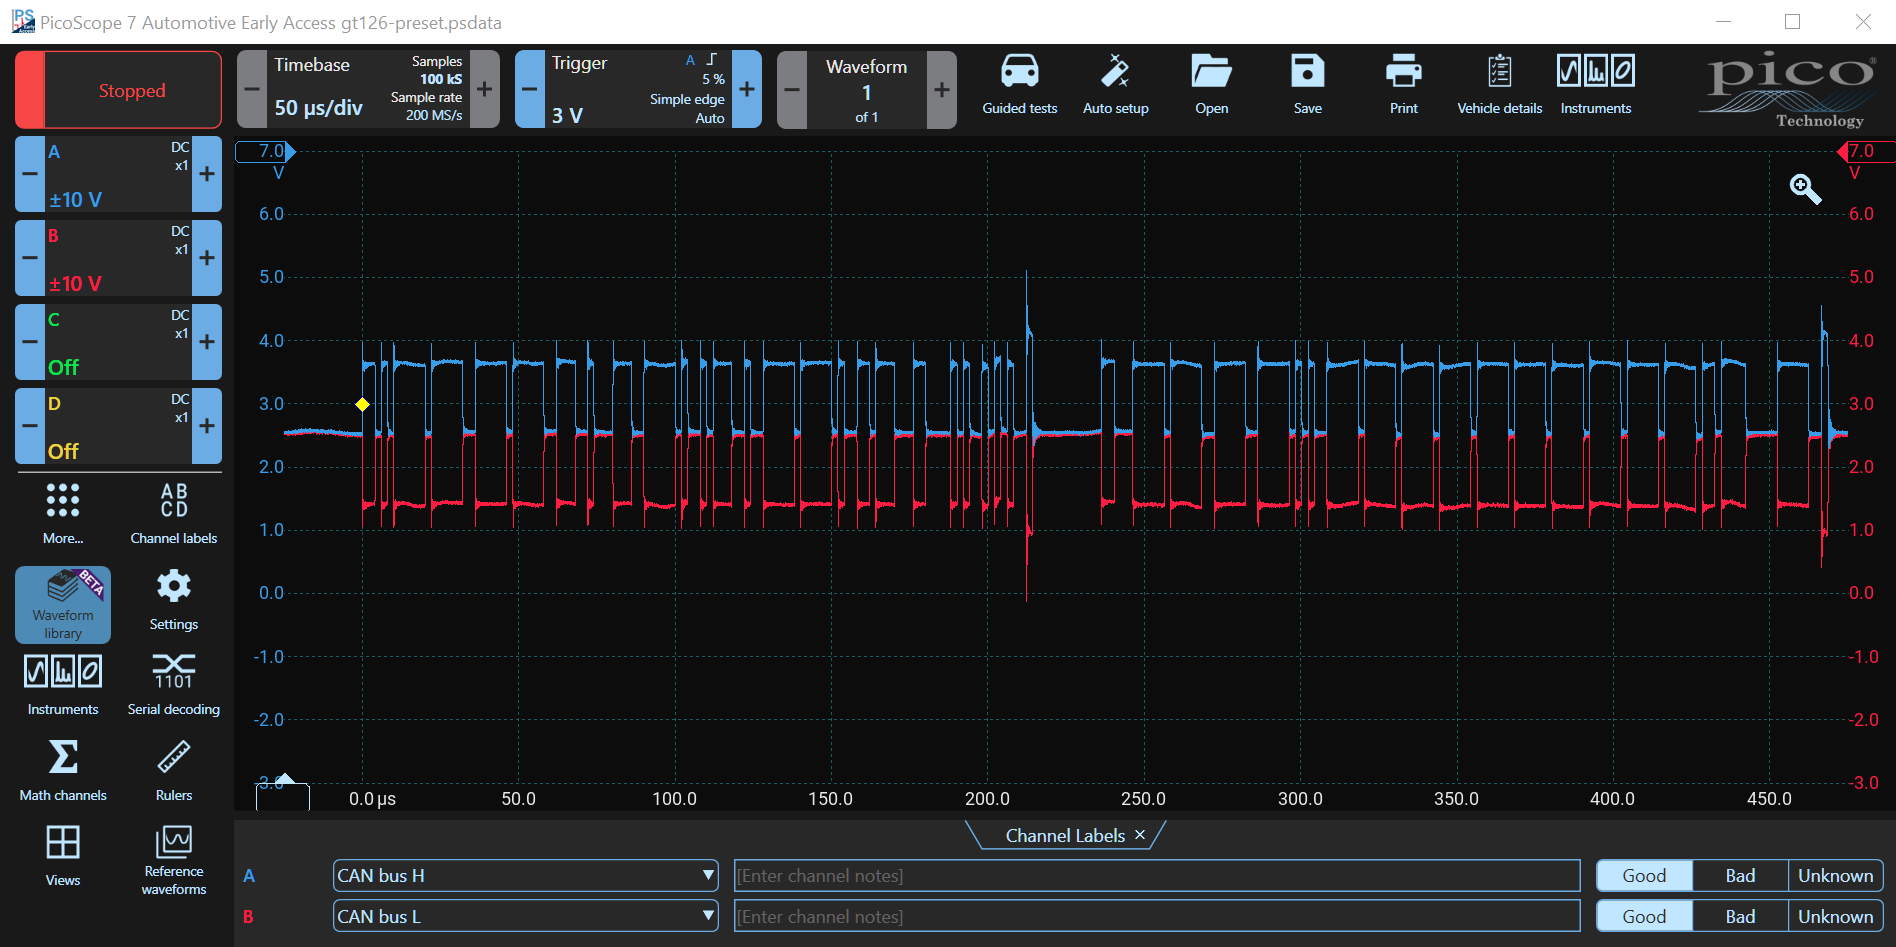
- The CAN-L and CAN-H waveforms mirror each other about 2.5 V, and each has 1 V peak-to-peak amplitude;
- The CAN-L waveform switches from 2.5 V down to 1.5 V, and the CAN-H waveform switches from 2.5 V up to 3.5 V.
- When the signals are both at 2.5 V, this is known as the recessive state and logic 1 is being sent. When the signals are apart, a logic zero is being sent;
- CAN-L and CAN-H remain at 2.5 V (recessive state) in the periods between messages;
- The low and high voltages should be relatively uniform without significant noise or distortion;
Using Maths Channels to Process CAN Bus Signals
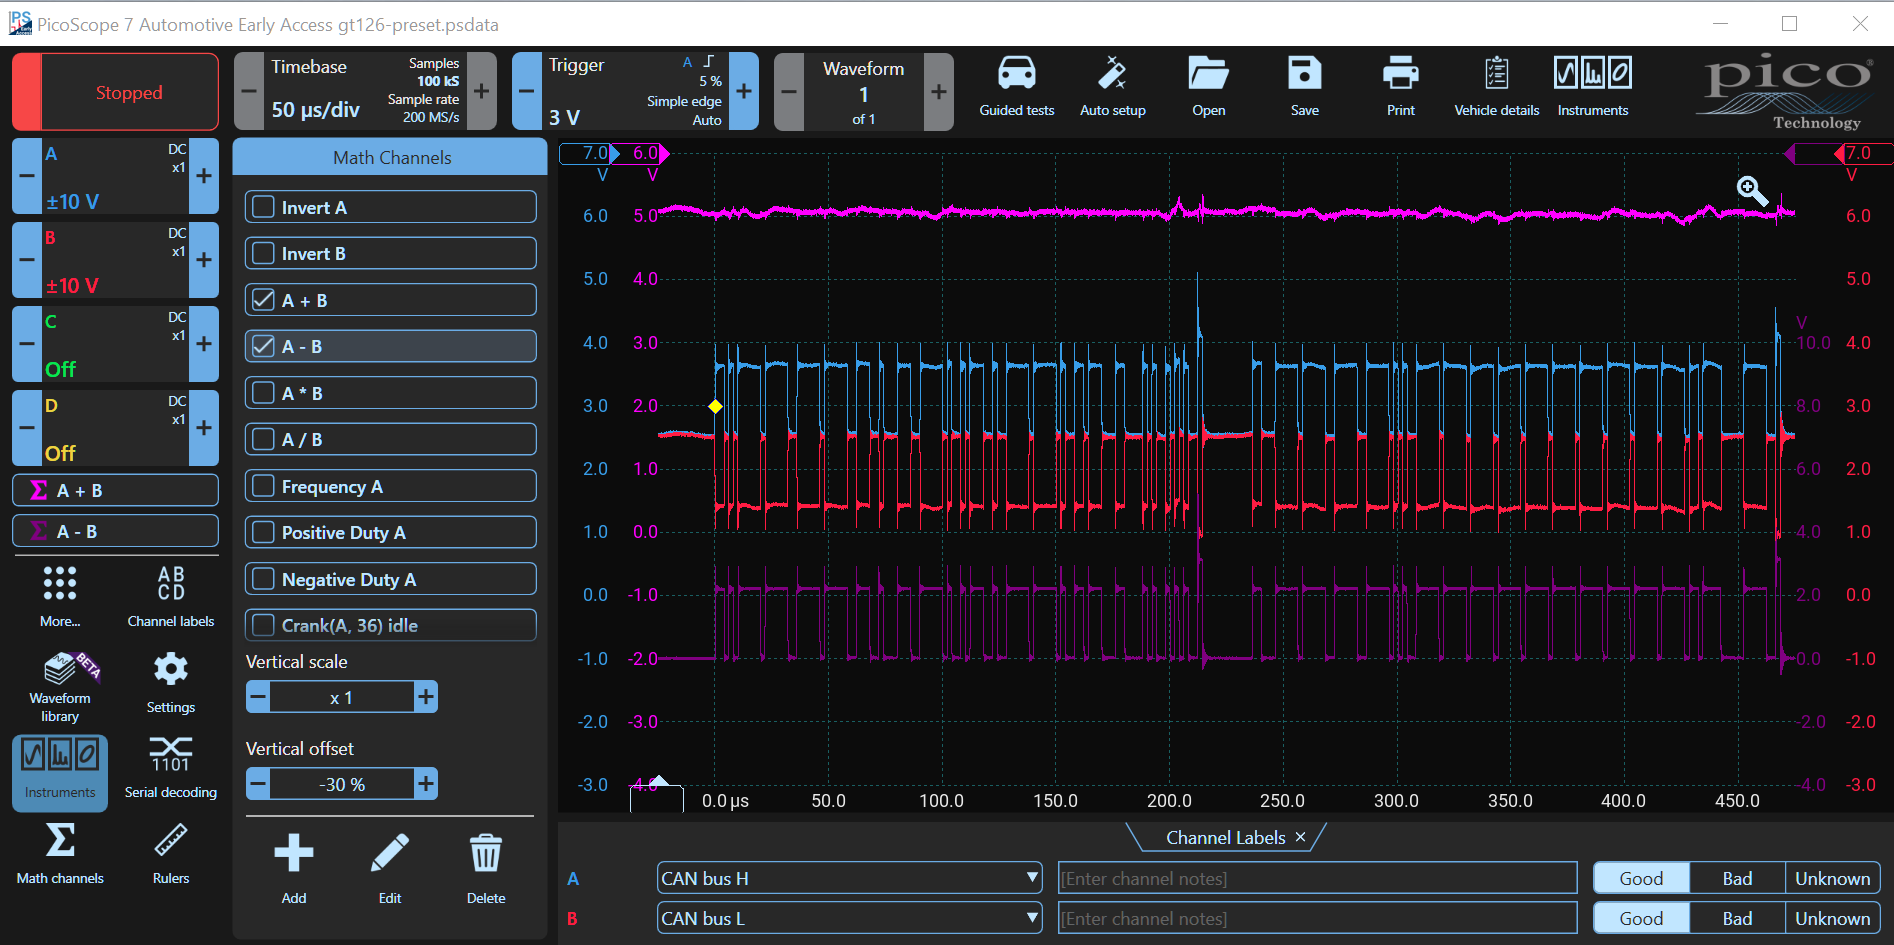
A CAN Bus Receiver subtracts the voltages on the two signals. Adding the two signals can isolate noise common to both channels.
Adding the Signals
The CAN Bus can reject noise superimposed on the two signals, within reason. If the noise is excessive, the receivers can be overloaded and data can be lost. Although CAN is relatively noise-immune, for the best reliability, sources of noise should be eliminated, as far as possible.
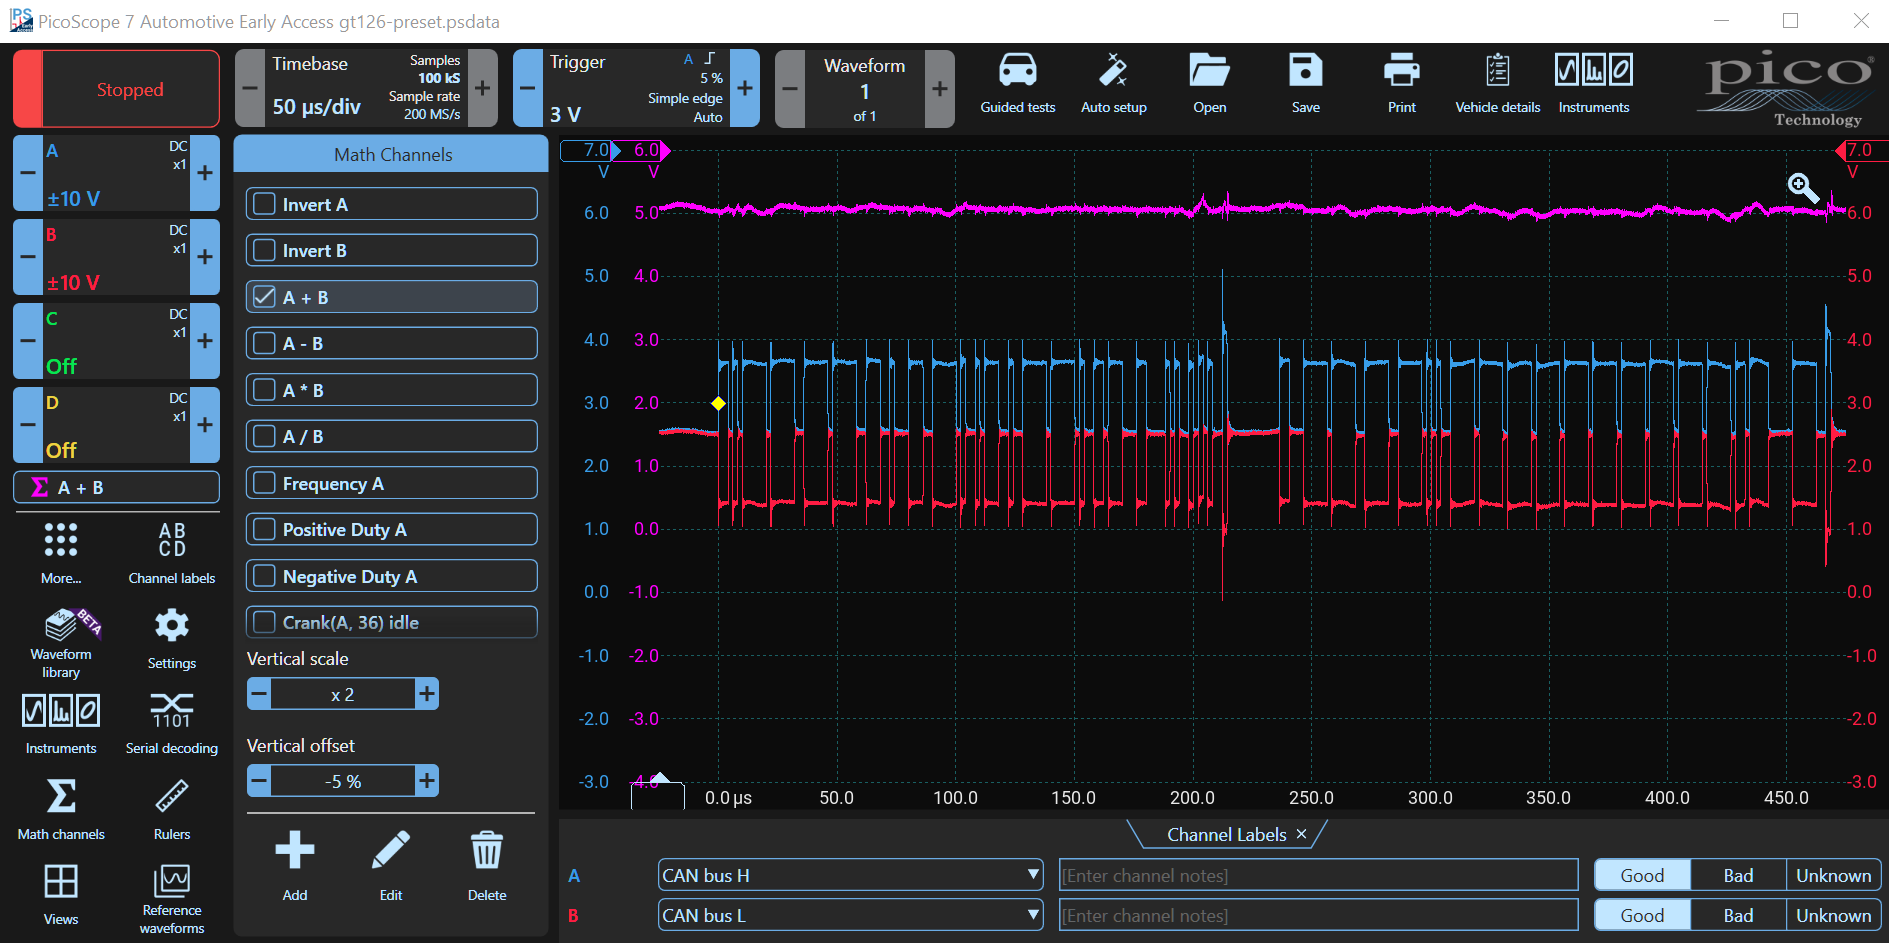
If you add the two signals together, then the sum should be a constant 5 V, in the absence of common-mode (on both signals at the same time) noise.
- In the recessive state, both signals are at 2.5 V, therefore 2.5 + 2.5 = 5 V; and
- In the active state CAN-H is at 3.5 V, and CAN-L is at 1.5 V, therefore 3.5 + 1.5 = 5 V.
Any noise common to both CAN-H and CAN-L creates a deviation from 5 V, which is twice the amplitude of the noise. This is an easy method to track down noise on the CAN bus.
PicoScope Setup
Use the following procedure to add the two channels:
- Select Math Channel or click More... to find it if it isn't on your menu;
- Select A+B
- You may find that a solid line is displayed at 1 V. You need to set the range correctly before the maths channel will be displayed correctly;
- Double-Click A+B and the Edit Math Channel Window will be displayed;
- Click Next and change the Max Range to 10 V and the Min Range to -10 V;
- Click Finish and drag the Math Channel Scale on the left vertically to move the waveform to a convenient location;
- Changing the Vertical Scale to x2 will provide more detail.
Notice the small variations from 5 V. These small deviations are normal and are easily disposed of by the receivers. Large deviations should be tracked down and eliminated.
Subtracting the Signals
Noise immunity is an important feature of CAN and is why it is so popular as an Automotive Network. The two signals are twisted together, and any external noise is superimposed on both simultaneously. Subtraction of the two signals by the CAN receivers cancels out this noise.
PicoScope Setup
You can use a Math Channel to do exactly the same thing with your PicoScope. The procedure is simple and very similar to the addition, above:
- Select 'Math Channel', or click More... to find it if it isn't on your menu;
- Select A-B
- You may find that a large signal is displayed. You need to set the range correctly before the maths channel will be displayed correctly;
- Double-Click A-B and the Edit Math Channel Window will be displayed;
- Click Next and change the Max Range to 10 V and the Min Range to -10 V;
- Click Finish and drag the Math Channel Scale on the right, vertically, to move the waveform to a convenient location;
- Keep the Vertical Scale at X1 so that there is room to decode the signal (we will do this next...).
If you examine the difference-waveform, you will see that the common mode noise highlighted in the sum waveform has been minimised and the signal is cleaner.
Decoding the Signals
Your PicoScope can decode the signals on the CAN Bus and display the data directly below the waveform or in a table. Data can be filtered and exported to programmes like Excel for analysis. We will perform the first step and decode the signal.
Determining the Baud Rate of the CAN Bus
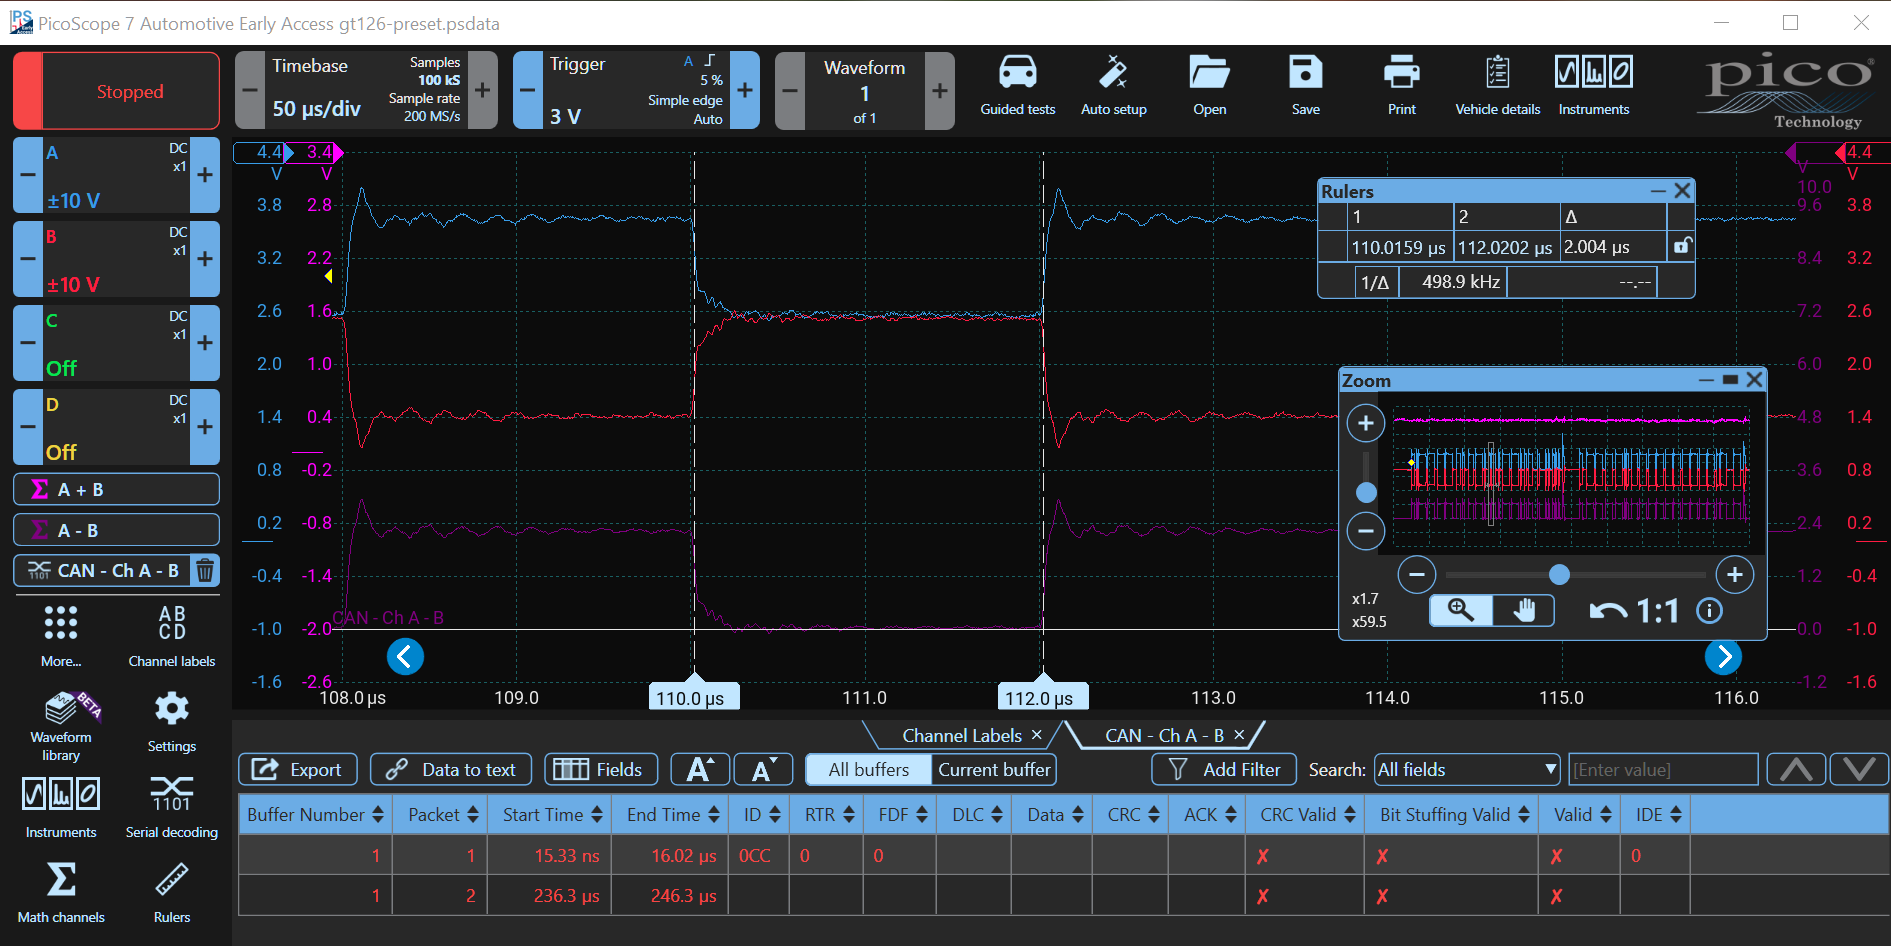
First, we need to find the baud rate of the CAN signal using the time rulers:
- Zoom into the A-B Signal and measure the width of the narrowest pulse using the time rulers;
- The width is 2 μs. The baud rate can be found by taking the reciprocal: baud = 1 / width;
- 1 / 0.000002 = 500,000 or 500kBaud.
Next we will set up the PicoScope to Decode the Signal
- Click Serial Decoding or More... if it isn't on your home menu;
- The PicoScope can decode many serial protocols, choose CAN, and click next;
- When decoding, you want to exclude as much noise as possible, so choose the difference waveform A-B;
- Change the Baud Rate to 500kBaud (click -);
- Notice that the default threshold is above the top of the A-B Waveform so change it to 1 V;
Examining the Decoded CAN Data
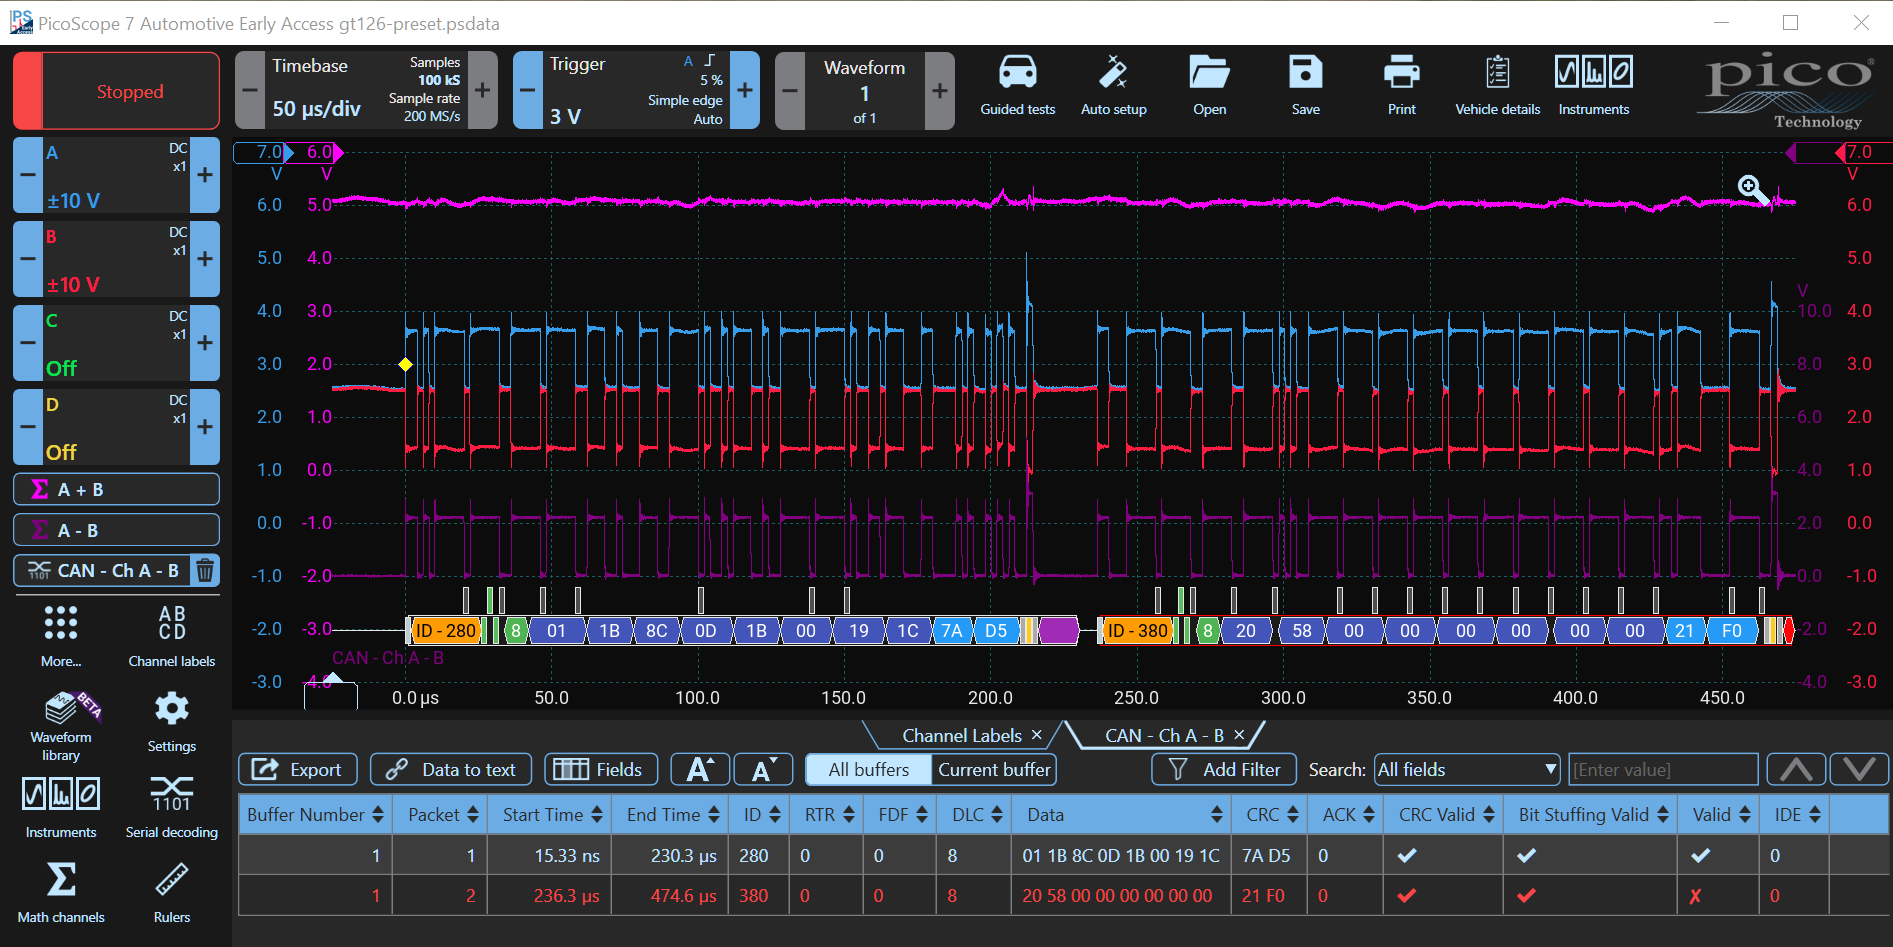
You can drag the decoded data up and down. If a logic level is repeated five times, the CAN protocol adds an opposite bit which is ignored by the receiver. This is called bit-stuffing. PicoScope shows the extra bits above the decoded data.
Notice how PicoScope highlights the difference between the different CAN data fields by using colour.
The data can also be saved into a table (at the bottom of the screen) where it can be filtered and exported.
Notice that the second packet in the table is red, denoting a failure. Actually, the packet is fine. However, because it is so close to the edge of the screen, the (purple in the first packet) end of a frame (inter-message gap) is truncated (red in the second packet), and PicoScope flags an error. PicoScope will flag any packet that fails with errors.
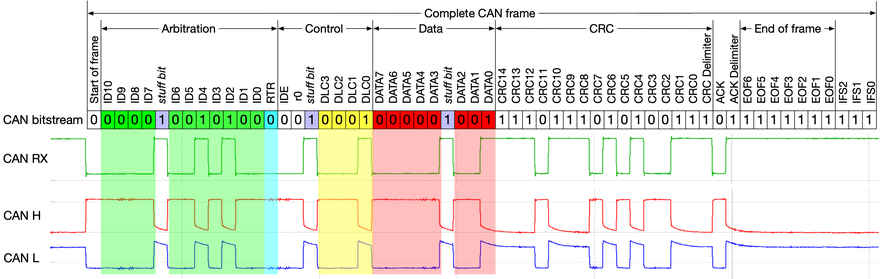
This is the general format of a CAN Bus Packet (beyond the scope of this article), see Wikipedia's CAN Bus article for more information.
Accessories
- PICO-PP619 CAN break out Test Box
- PICO-TA499 PicoBNC+ 10:1 Automotive Scope Probe
- PICO-TA375 BNC 100MHz Scope Probe
Also, visit our CAN Bus Videos Page.