


PicoScope CAN Bus Noise Detection and Rejection
Decoding CAN Signals
Many oscilloscope manufacturers have decoders for protocols like CAN, serial data, etc. but often they are optional enhancements that need to be paid for separately. PicoScope 7 includes all encoders (currently 40) with the software for free.
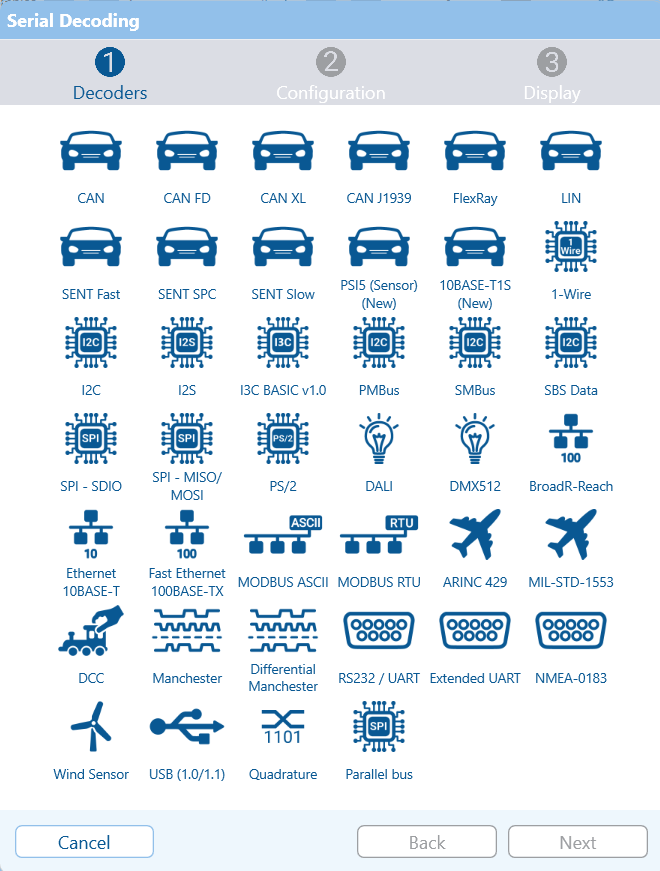
Decode CAN by clicking on the Serial decoding icon (use More if it is not available). Select CAN from the list of Serial Decoders and click Next.
CAN Parameters
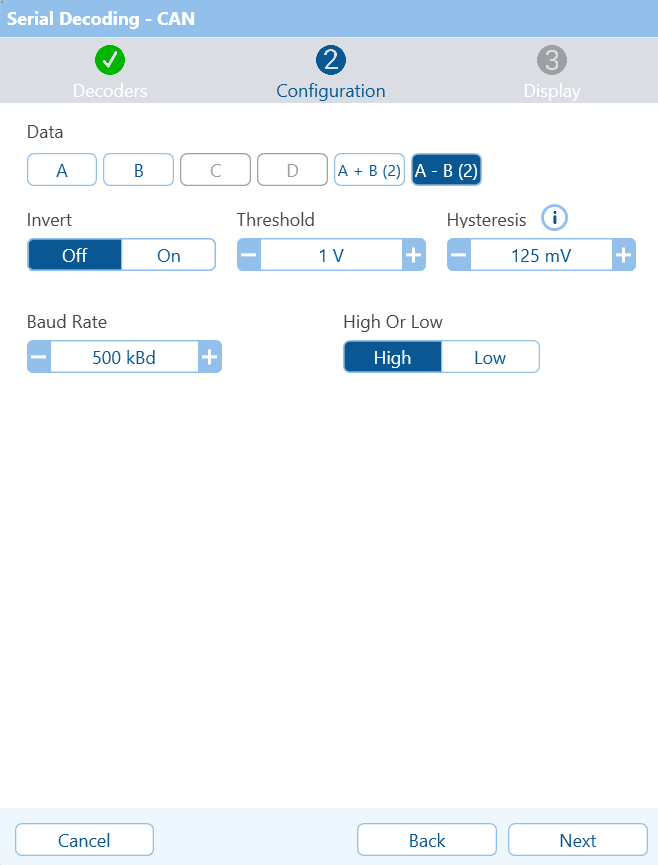
You can decode data from any channel, including the Maths Channels. We will use the difference-channel because, as we have seen, it is more reliable because noise has been rejected.
The signal invert button is a little confusing because the decoded signal is inverted. However, there is another control: 'High Or Low', which has the effect of inverting the signal (again). Choose Invert Off, and we will determine the polarity using the High or Low selection.
The difference signal is between 0 V and 2 V, so a good threshold would be half-way between the two. We will use 1 V.
Hysteresis allows us to set two thresholds when detecting signal changes. The first threshold is the signal level at which the signal is considered to be on. The second threshold is the signal level at which the signal is considered to be off. When the signal is going high, then the threshold is 125 mV above the threshold when the signal is going low. That means that the positive going threshold is at 1.0625 V and the negative going threshold is at 0.875 V. The reason for introducing hysteresis is to further increase the noise immunity of the system.
We have already measured the Baud Rate (Bit Rate), and the default value of 500 kbd is appropriate.
If you look at the captured waveforms, CAN-H is inverted whereas CAN-L is non-inverted. The High Or Low control selects between signals that are like CAN High or Low. As the difference signal is inverted, it is like CAN-H, and therefore we will choose High.
Click Next to continue
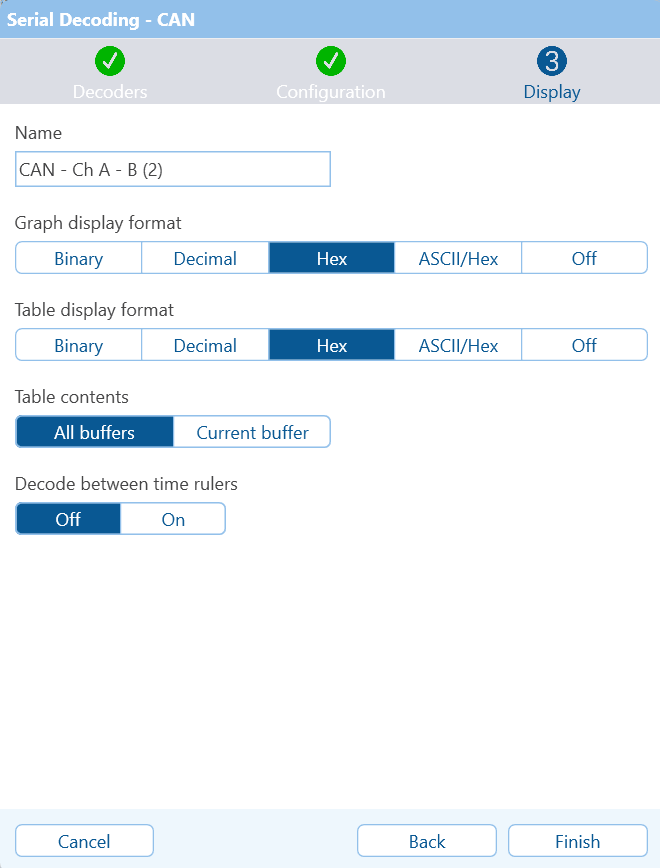
PicoScope has chosen a name and suggested that we display the data on the graph and in a table in Hex (base 16). The entire capture (all buffers) will be decoded, and we will ignore the rulers. All of these selections are OK so click Finish.
Decoded CAN Messages
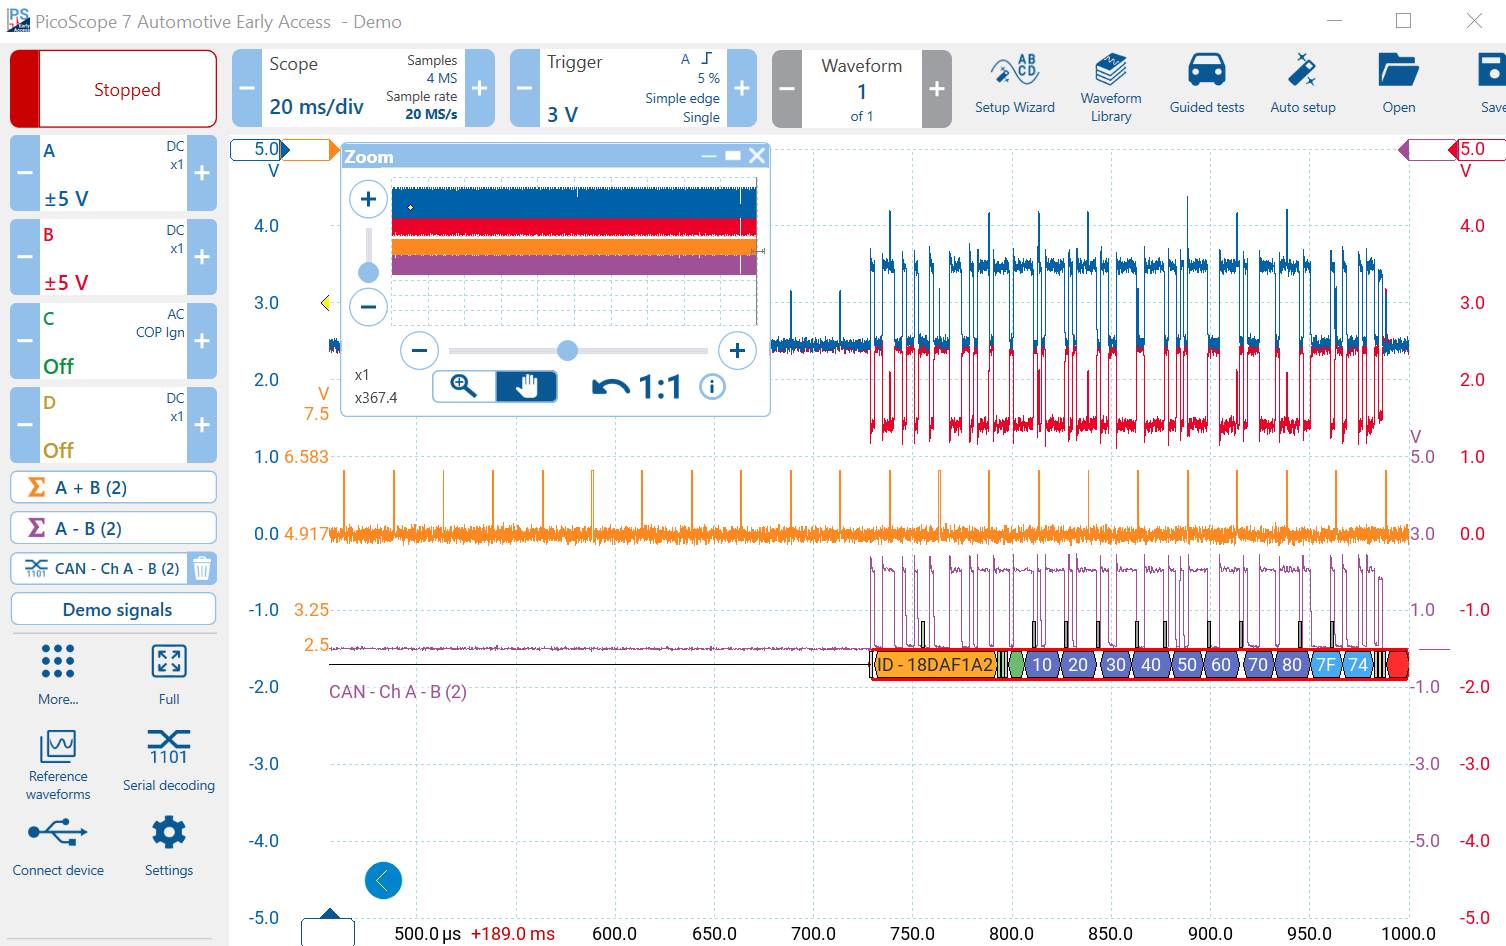
The PicoScope has decoded the CAN messages and placed the results directly under each packet. It also created a table with all the messages captured.
Notice that we have selected message 10, the latest message (by double-clicking the message in the table). The ID and data are shown underneath the packet and are the same as the data in the table. Notice that some messages have failed and are displayed in red. This is because the messages have been split up into different buffers and were incomplete. We will solve that problem below. First, let's look at the data that Pico has provided.
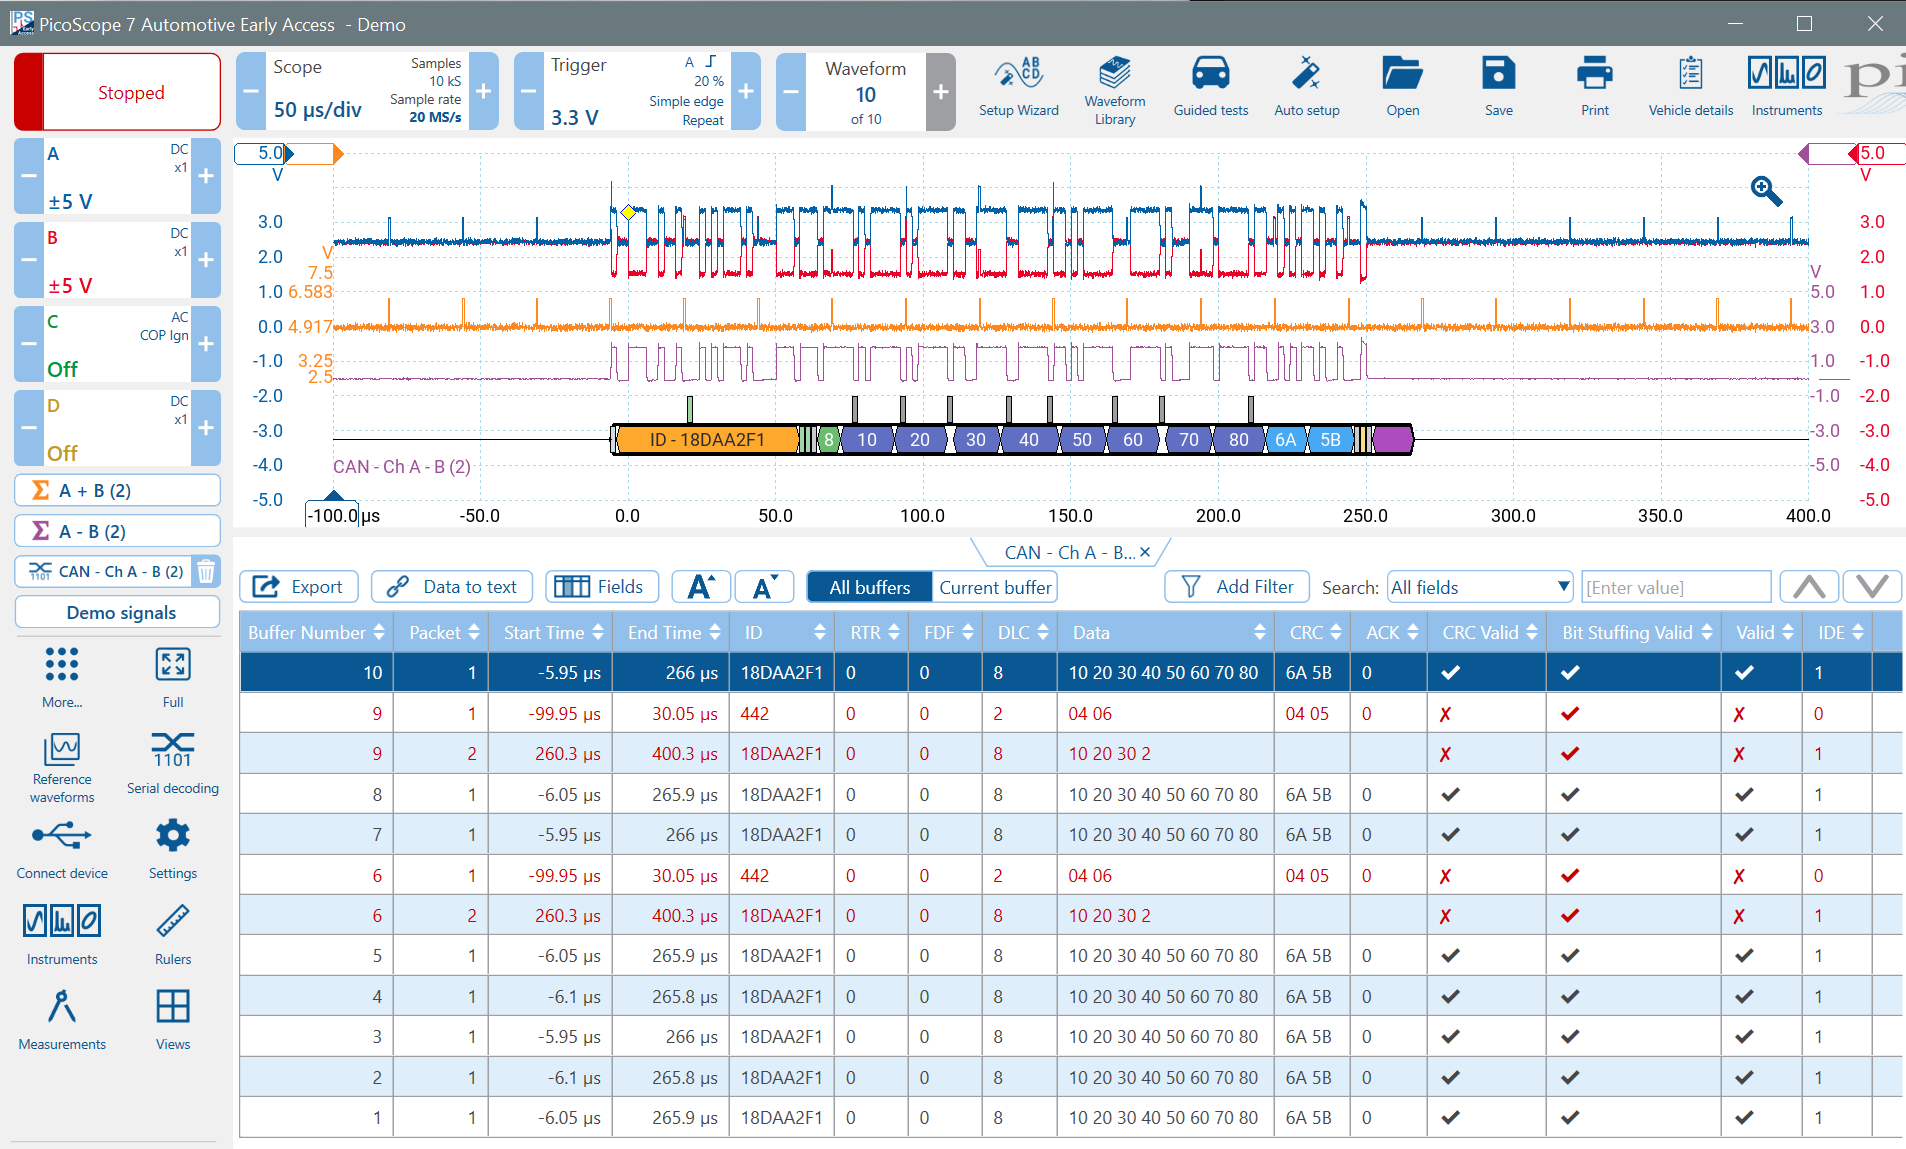
Decoded Display Message
Pico has colour-coded parts of the message on the display for easy identification:
- The very first bit (Start Bit) is in white and must be zero to start the message.
- The ID or Source Address follows in yellow.
- Control bits (the message's header) are in green.
- The dark blue bytes are the message's data or payload (This is the data that is being transferred).
- Following that is the CRC (Cyclic Redundancy Check) in light blue (used to see if any errors are present in the message).
- The middle bit in the light yellow area following the CRC is the ACK (acknowledge) bit,
which is a dominant bit sent by all devices that received the message*.
This bit can often be larger in amplitude than the others as many devices can send it at once. - The purple area following the message is the minimum inter-message gap, which must be recessive.
* The ACK bit is not sent by the transmitting ECU even though the message it sent is also received by it.
Bit-Stuffing
Notice that there are a number of markers above the decoded data. When a CAN message is sent, the designers wanted to avoid long runs of the same data which produces a DC component. If five consecutive bits are the same, an additional opposite bit is inserted automatically in the transmitted message. If five consecutive bits are the same in the received message, the receiver automatically removes the next bit. Pico highlights these bits in the decoded message. They are positioned above the message to emphasise that they are not part of the data being sent.
Message Table
All decoded messages are displayed in the table. The user-selectable columns show the message contents. You can filter the messages to see only certain types of messages, and you can export them for external analysis (e.g. to Excel).
As previously mentioned, if you double-click a message in the table, Pico will navigate to that message and zoom in so that you can see it more clearly
Waveform Buffers cause Errors
You may have noticed that many messages have errors. The errors are not present in the CAN message stream but are as a result of poor PicoScope setup.
The problem is Waveform Buffers. The waveform buffer feature is very powerful when used in conjunction with triggering. Each time the PicoScope triggers, the event is stored in a buffer.
Waveform buffers are not good at continuous signals. A little data is lost whenever a new trace is started, and in the case of CAN, a packet may be split across the boundary between two buffers, causing the decoding to fail.
The solution is to reduce the number of buffers to one and to change the timebase to capture more packets in one sweep.
Sampling Rate
When you change the timebase, keep an eye on the Sample Rate. Although the storage space in a PicoScope is large, 250 million samples, it isn't infinite, and the PicoScope software will reduce the sample rate automatically if the buffer storage space is exceeded. Remember that you need multiple samples per bit, for effective decoding. A rule of thumb is always sample at least five to ten times faster than the data rate
In the demo scope, if you change the timebase to 2 sec per division, you will see the sample rate drop to 5 MS/s. At 5 seconds per division, the Sample Rate drops to 2.5 MS/s.
PicoScope Setup for Efficient CAN Capture
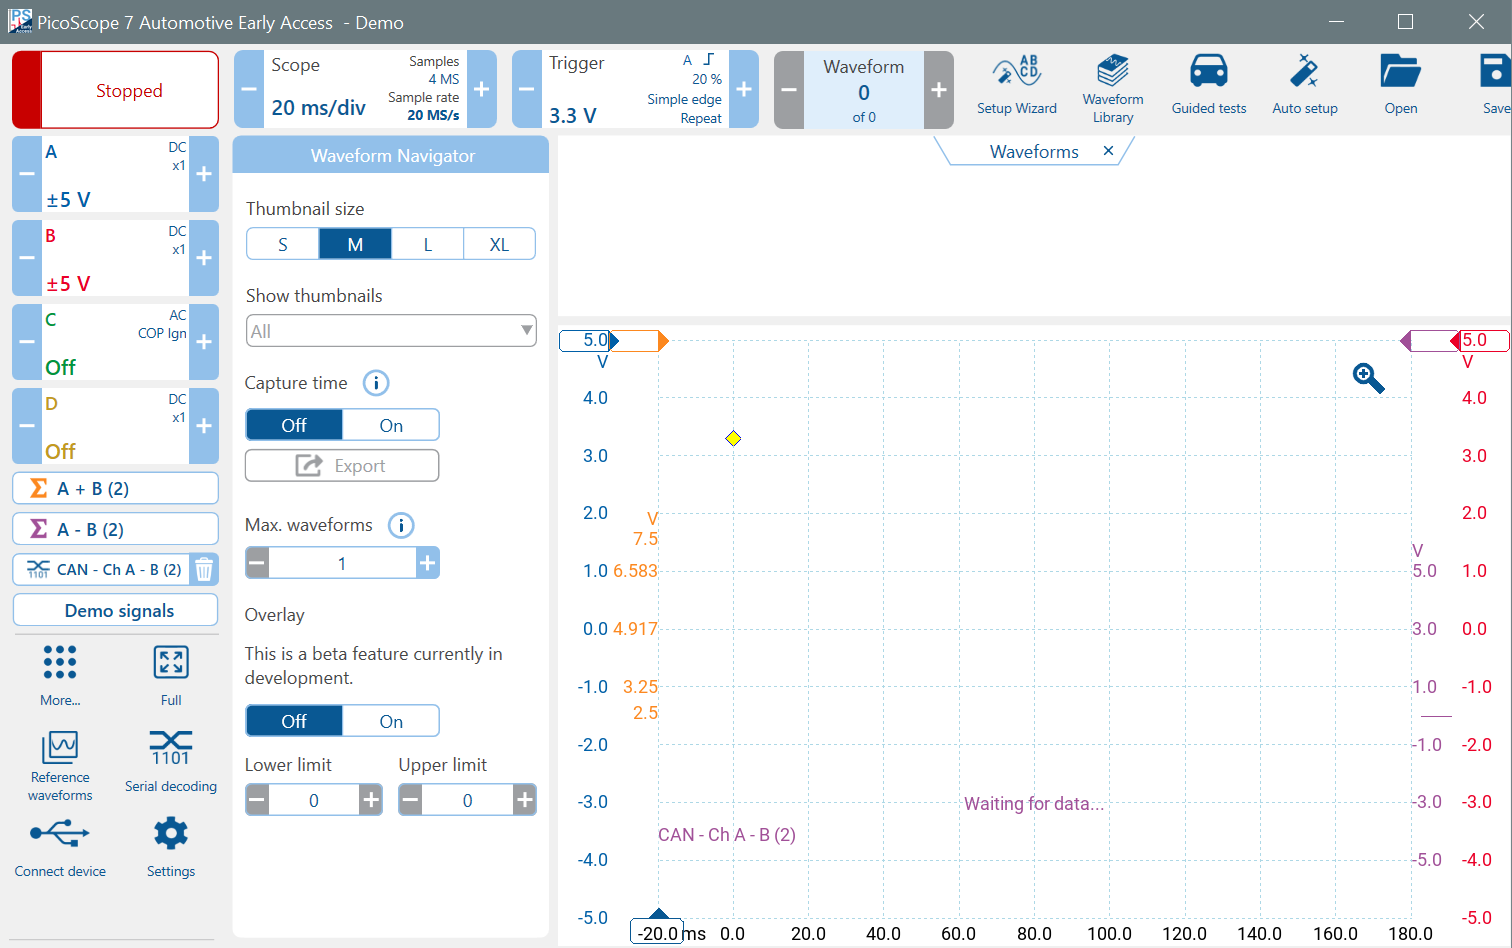
Start by setting the Waveform Buffers to 1. Click on the Waveform Lozenge and the waveform navigator will appear. Set Max waveforms to 1. Close the Waveforms display area at the top of the screen by clicking on the little cross.
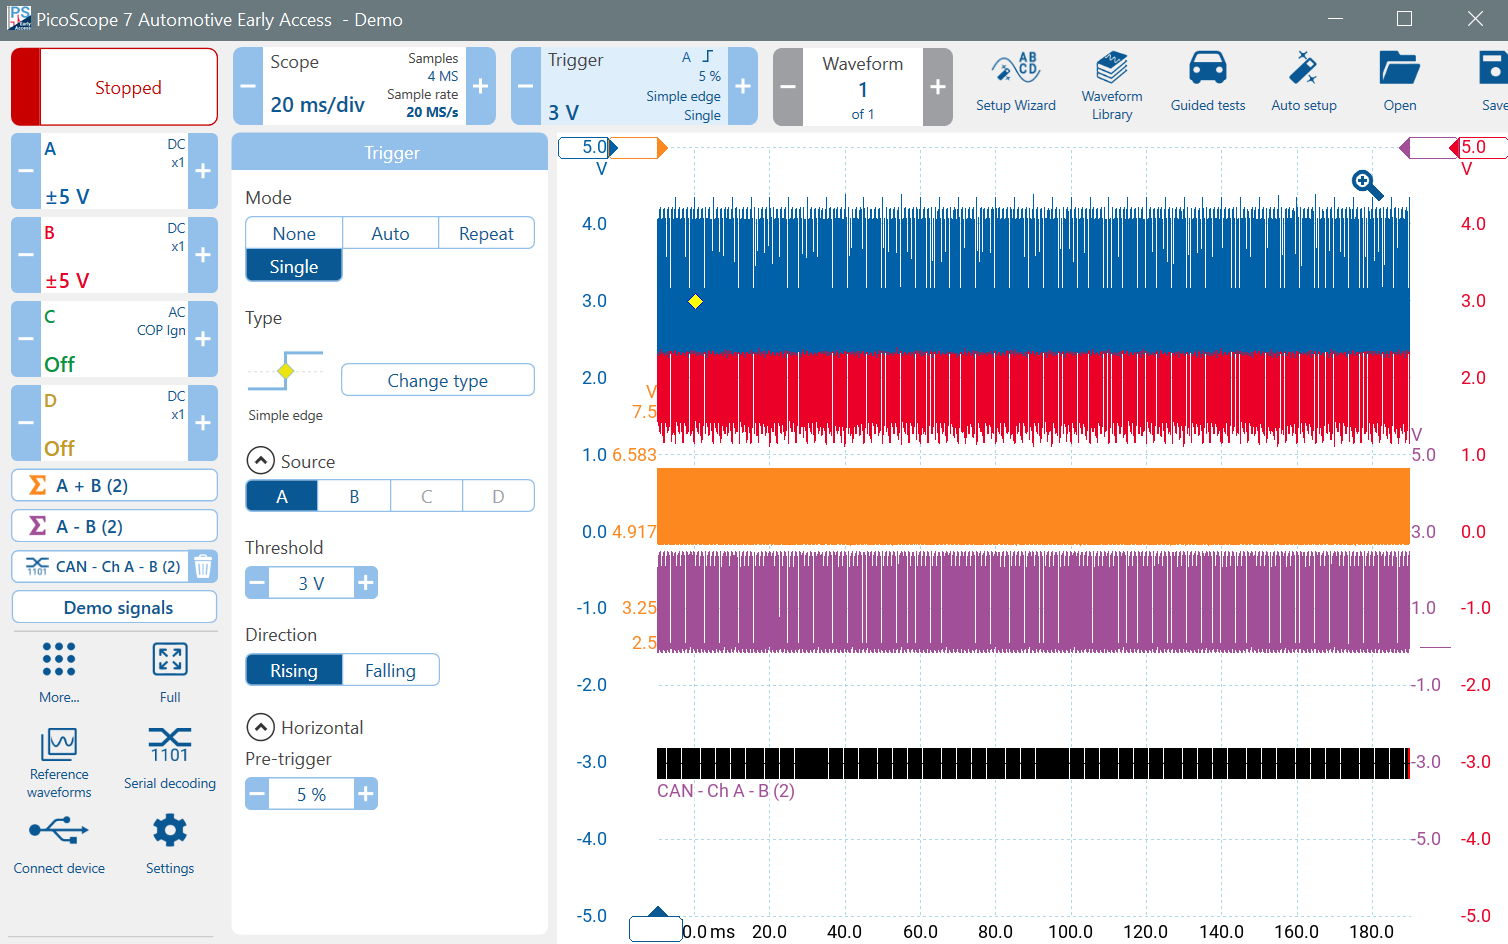
Set the timebase to 20 ms/div, which will still allow 20 MS/s Sample Rate.
Triggering on a data stream such as CAN to isolate a specific message is challenging. However, we want to capture one screen with many messages, and we want to stop at the end of the capture to view the result, so a single-shot trigger is appropriate.
Click on Trigger and choose:
- Mode: Single
- Type: Simple Edge
- Source: A
- Threshold: 3 V (CAN-H goes from 2.5 to 3.5 V)
- Direction: Rising
- Pre-trigger: 5%
Click Start to start the capture.
If you want to enable and disable the CAN data table, click on the CAN button (above Demo signals), click Next and update "Table display format".
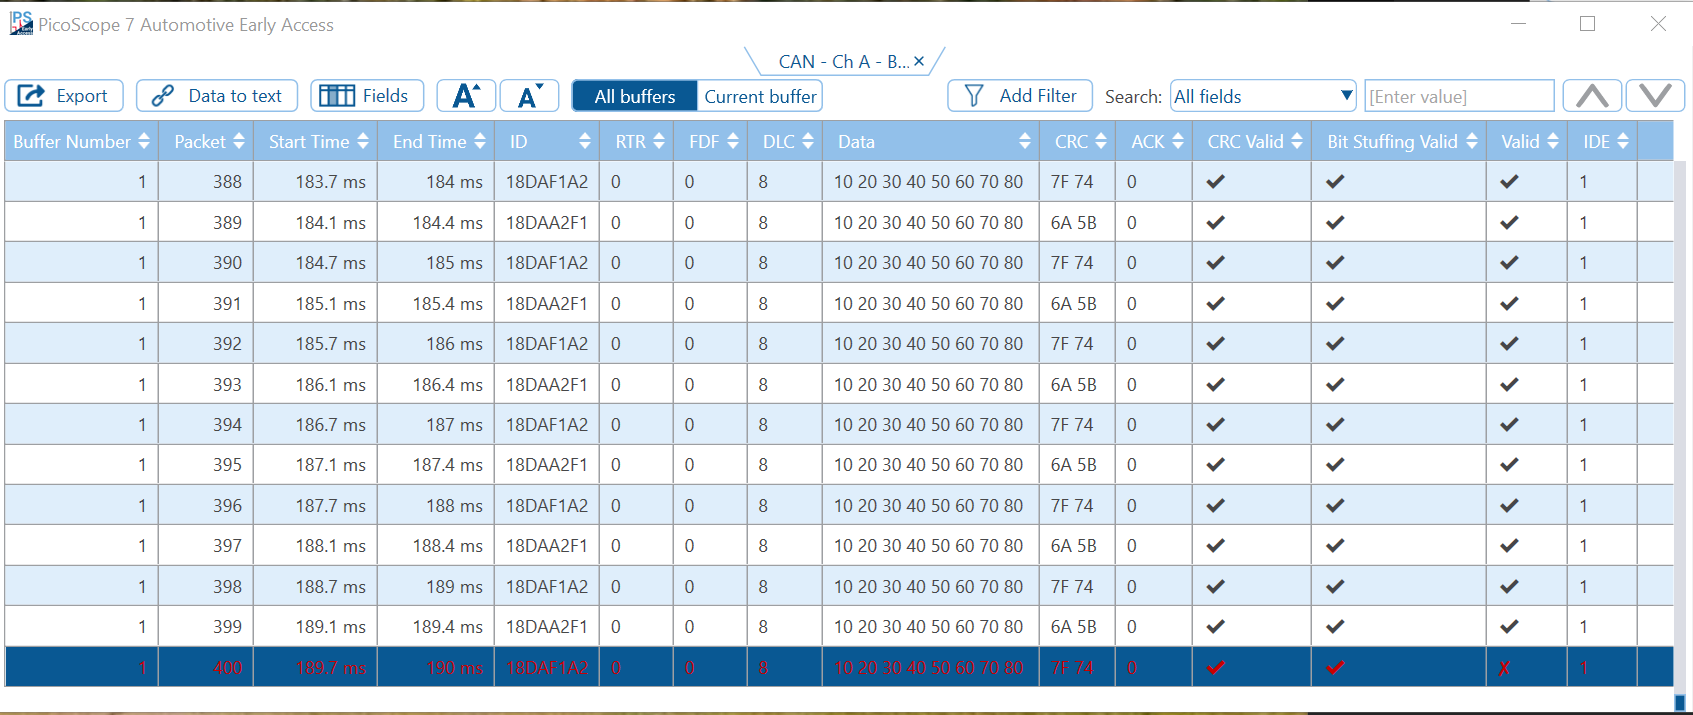
You can drag (using the tab above the data) the table out of PicoScope, completely.
There are 400 messages in the buffer. The last message has an error because its inter-message delay overlapped the end of the buffer and was truncated. Double-click it to see the problem. Your result may be different.
Triggering Considerations and Techniques
As previously mentioned, triggering a CAN signal is often challenging. CAN signals in vehicles are used to carry messages about the condition of sensors or are used to control actuators.
Trigger your PicoScope on a sensor output and look at the CAN messages that follow its change. Alternatively, trigger your PicoScope on an actuator input and look at the CAN messages that immediately precede the change, during the pre-trigger period.
Exercises
You can zoom and look at any of the messages. Use the data table to select a message of interest. Try sorting and exporting the data table. Also try filtering the results, e.g. try filtering for ID contains 18DAA2F1.
We hope you enjoyed the Demo Mode course.
You can browse through our videos or learn more by completing our Top-10 Tests course.
Enjoy our CAN Bus Testing and Serial Decoding Videos.