


A new Demo Mode Course has been created.
Channel B Setup and Zooming into a Waveform
Zoom into a Waveform
Change the timebase back to 10 ms per division and turn off Channel B. The trigger automatically reverts to Channel A again. Set the pre-trigger to 20% again, rising with a threshold of 10 V.
When you zoom into a waveform, you expect to be able to see detail clearly. The 4425A PicoScope has an extremely large buffer memory (250 million samples) and an impressive maximum sample rate (400 million samples per second). This is important because, to see detail when zooming, the detail must be recorded first.
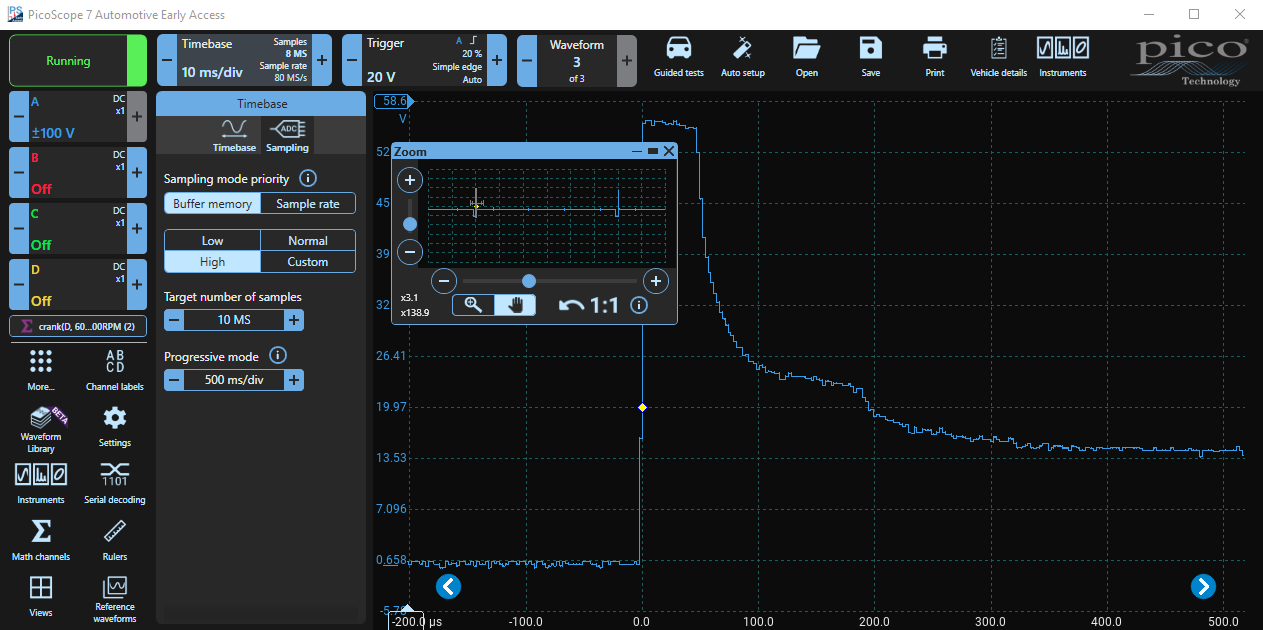
With the scope Running, click Zoom — the little magnifying glass on the top right of the display. Use your mouse to draw a box around the first injector event. The display zooms in, and you can see much more detail.
Notice the hump in the curve following the voltage spike. That is caused by the change in inductance as the pintle returns and the injector closes. If that hump is absent, then the injector's pintle may be stuck. Close the Zoom Window and the entire waveform will be displayed again.
Quantisation Errors
Quantisation occurs because PicoScope is digital and sampling is in discrete steps. When you understand that, you can use simple techniques to increase resolution and allow you to see greater detail in the waveforms you capture.
Timebase Adjustment vs Zooming
Remember from the previous page, we effectively 'zoomed' into an injection event by changing the timebase. We magnified the event and it filled the screen. The scope only sampled that event, not all the space between the injection pulses, so the horizontal resolution was increased.
Zooming is different, it takes a previously scanned waveform and stretches it, so resolution is actually decreased.
PicoScope has extremely high resolution that can support deep zooming and still display an acceptable result. However, bear in mind that resolution is degraded by zooming, and if you want superfine detail, try to adjust the timebase and triggering to achieve the best results, before zooming.
Vertical Scale Adjustment vs Zooming
When you set the channel voltage range, bear in mind that a PicoScope is digital. The input voltage is sampled by a 12-bit Analogue to Digital Converter (ADC). 12 bits provide 4096 levels, so if the scope is set to ±200V, the difference in voltage is 400 V from maximum to minimum. The resolution is therefore 400 V / 4096 levels = 97.6 mV. That resolution is far better (sixteen times) than an 8-bit scope (256 levels) where resolution drops to 1.56 V on a ±200V input. If you measure a 1 V signal on a 12-bit scope at ±200V, there would only be about 10 levels from the bottom to the top of the signal. The signal would not even be visible at ±200V, on an 8-bit scope!
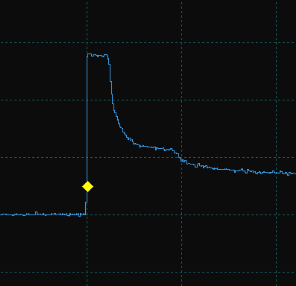
Zooming into that signal would increase the size of the steps, not the number, and produce a 10-step staircase effect. You can see that effect in the image below where the voltage reduces in steps after the back-EMF spike. Compare it to the same spike in this image, from the previous page, which did not use zooming.
If you set the vertical scale correctly to ±2V (±1 V might result in over-voltage on a 1 V signal), then there would be a 4 V difference between maximum and minimum. Each level would be 976 μV, and the scope would display about 1024 levels from the top to the bottom of the signal. Much greater detail (100 times) is available.
Quantisation Summary
Remember that a PicoScope is digital. Quantisation means that sampling is in discrete steps. Maximise the number of samples — both horizontally and vertically — first, so that you achieve the best resolution and detail before zooming.
Changing the number of Samples
Engineering is all about compromise... You can control the sampling rate of your PicoScope. More samples means greater resolution as described above, whereas reducing the number of samples increases the number of waveforms that can be stored.
Zoom in and show one ignition event.
Click on the Timebase control and select the Sampling Tab. Select Buffer Memory and try selecting Low, Normal, and then High to see the effect. Notice how the Target Number of Samples changes and the Sample Rate in the Timebase control also changes.
As you increase the sample rate, more data is collected, and therefore, fewer waveform buffers are available. In this example, on Low there are 32 waveform buffers, on Normal there are 7, and on High there are only 3 — but with much more detail. The triggering will also be more stable with more samples because the samples are closer together.
Now draw a zoom box around the voltage spike from just before it rises to when it flattens out to zoom in further. Again, try clicking Low Medium and High and see the effect — especially on triggering. Leave the sampling on High and close the Zoom Box, and the full screen will be displayed.
Configuring Channel B
Click on the Channel B Control and set it up as follows:
- Display Tab
- Scale x1
- Offset 0%
- DSP Tab
- Low-Pass Filter Off
- Resolution-Enhance 12 bits
- Probes Tab
- Select the PICO-TA018 20/60A Current Probe and then 20 A
- Vertical Tab
- Select ±2A
- Invert Off
Zoom in and see both Waveforms
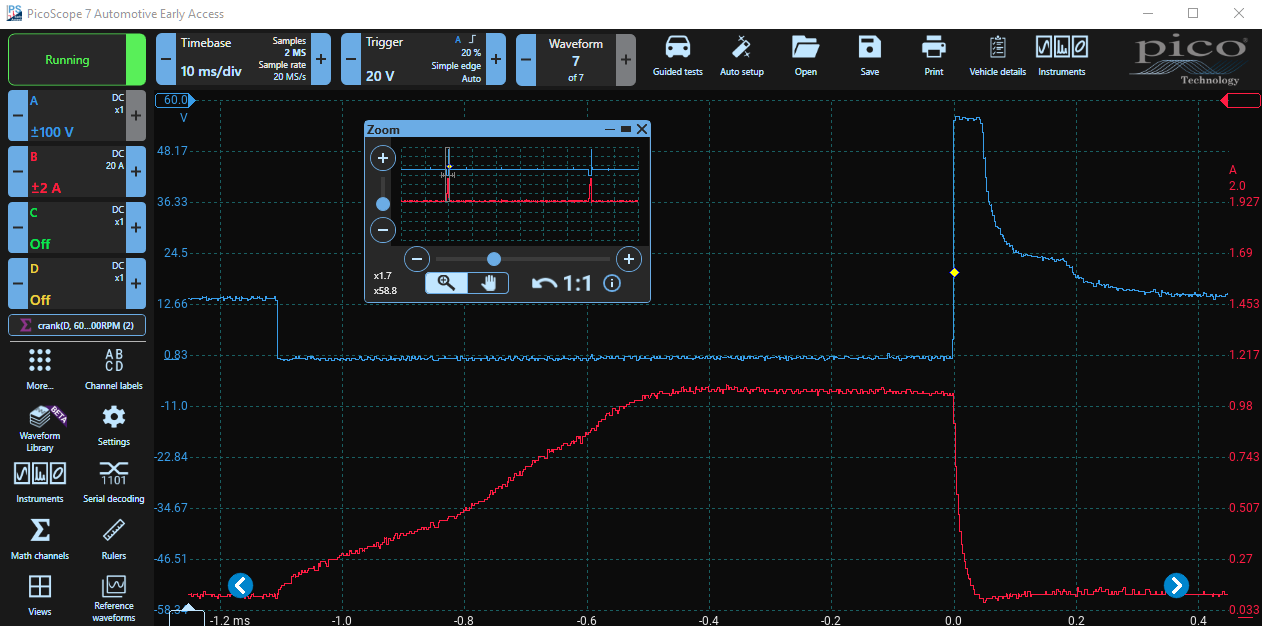
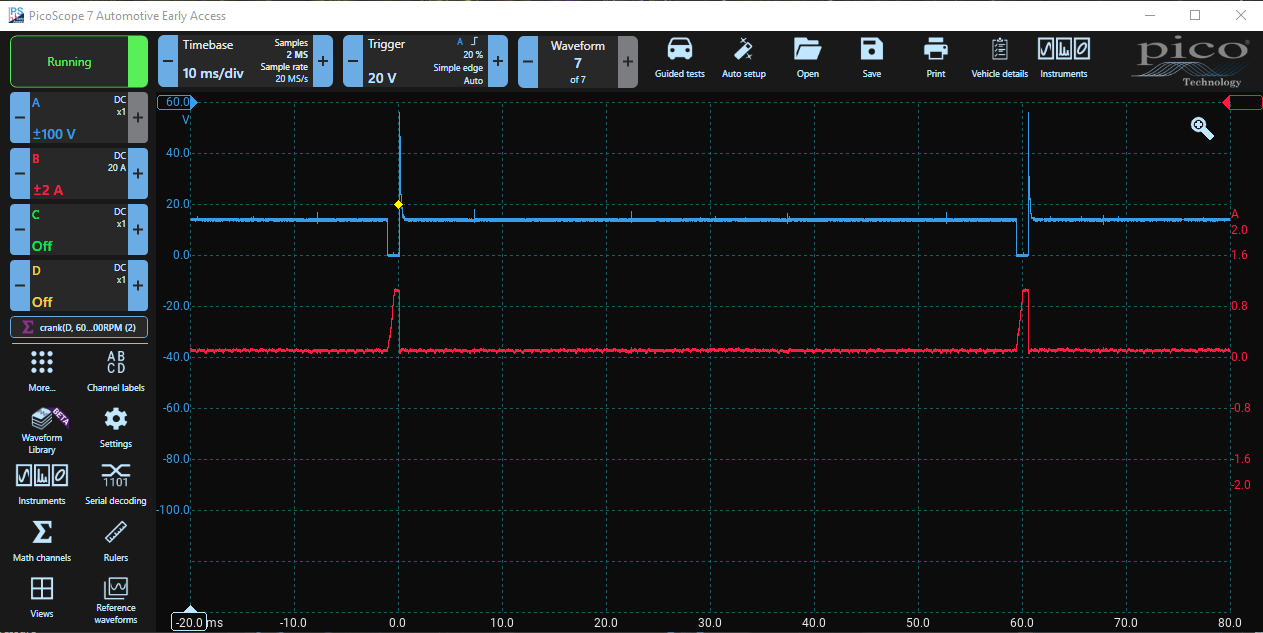
Notice how the Red Current Waveform on Channel B now overlaps the Voltage Waveform on Channel A. Drag Voltage Waveform up by two divisions (using the blue scale on the left) and the Current Waveform down by one division (using the red scale on the right). Before you zoom, notice that the slightly sloping rising edge of the current waveform appears straight and smooth because you are zoomed out. Now draw a zoom box around the injector event voltage and current waveform to zoom in.
Notice how the rising edge is slightly concave because the pintle moved, opening the injector, and the inductance changed. The effect is quite subtle in this example but can be much more pronounced in other injectors. In this example, the injector opened at about -0.8 ms and closed at about +0.2 ms. It was open for about 1 ms. Also notice that current was limited, either by the injector's coil resistance or by the ECU driver. Close the Zoom Box.
Scaling a Waveform
If you want to fit the waveforms onto the display or to increase their size if they are too small, you can change the scaling. This does not change the sampling resolution (vertical tab) but merely changes the size on the display. Click on the Channel B control, select Display, and change the Scale to x0.5. Notice how the scale on the right side of the display changes to match the new scale factor. Move channel B up by one division (0 on the centre line). This leaves space for Channels C and D.
Effect on Sampling and Buffers
PicoScope 7 may change parameters automatically as you work to try to create the best image or setup. When you enabled Channel B, notice that the number of Waveform Buffers increased from 3 to 7! This seems odd because enabling another channel should produce more samples and leave less space for waveform buffers. However, look at the Timebase control. PicoScope 7 has reduced the sample rate to 20 MS/s, and hence the number of samples from 8 MS to 2 MS. This reduced the space required and allowed more waveform buffers to be added.
Finally, notice the little spikes on the Channel A waveform. These are due to interference caused by ignition. We will examine the ignition waveforms and how they relate to the crankshaft sensor on the next page.