


PicoScope Ignition Analysis using a COP Probe<
Channel D - Crank Sensor
This vehicle has a hall-effect crankshaft sensor. Many hall effect sensors only have a 5 V output. This vehicle's sensor output is battery voltage. You will also find that the number of teeth differs. Common variations are 36 and 60 (including the missing teeth), but others also exist. Be prepared for endless variations between different makes and models and adjust the scope accordingly.
This is where the PicoScope Waveform Library can be very helpful. Download known-good waveforms for your particular vehicle to compare with your captures.
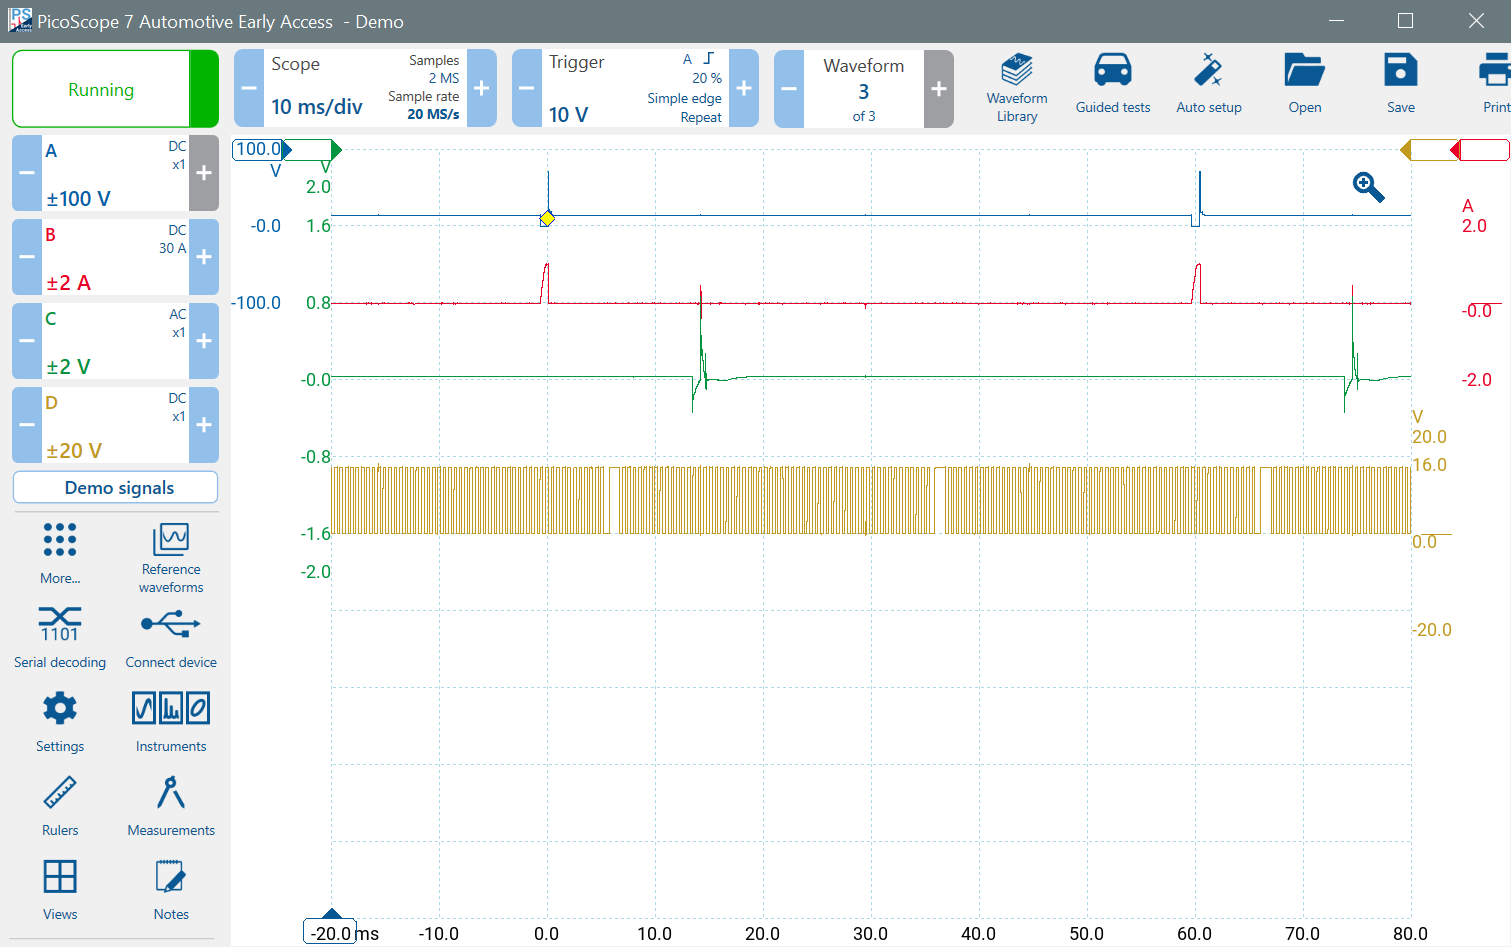
Configuring Channel D
Click on the Channel D Control and set it up as follows:
- Probes Tab
- Select X1 (Test Lead)
- Vertical Tab
- Select ±20V
- Coupling DC
- Invert Off
- DSP Tab
- Low-Pass Filter Off
- Resolution-Enhance 12 bits
- Display Tab
- Scale x0.25
- Offset 0%
Understanding a Crankshaft Sensor Waveform
There are two main types of crankshaft sensors: Hall Effect and Inductive.
Inductive Sensor
The image below from the old demo software shows that the crank waveform amplitude varies in proportion to engine speed and the distance from the reluctor teeth and the sensor.
If you measure across the coil, an inductive crank waveform is usually centred around zero (it goes negative and positive). In this case, the waveform is offset by 2 V, probably caused by an applied offset voltage from the ECU, because the measurement is taken relative to ground.
Hall Effect Sensor
Compare that waveform with the hall sensor output above. The waveform is 'digital'. Its amplitude is constant (usually 5 V), but in this case it is the battery voltage (about 14 V).
Noise Immunity
If you look carefully at the inductive waveform, you will see noise, both as ignition spikes and in the gaps created by the missing teeth. That noise can be misinterpreted by the ECU and can cause timing errors. The hall sensors are less prone (but not immune) to noise and are therefore more reliable.
Timing
The crank sensor measures engine speed. The closer the pulses are together, the higher the frequency and hence engine speed. Engine timing is related to the position of the missing teeth. Remember that the missing teeth position also varies from engine to engine and does not necessarily align with TDC or BDC. Again, use the waveform library to determine whether your engine timing is correct.
The crankshaft rotates once per revolution, and therefore the missing teeth gap occurs once per revolution.
Measuring Engine Rotational Speed
As previously mentioned, engine speed varies. Sometimes, a cylinder might not be as efficient as the others, and sometimes a misfire will cause the rotational speed to vary more than usual. Hence, to accurately measure the engine speed by measuring just one revolution might produce an erroneous result.
A four-stroke engine requires two revolutions for all cylinders to fire, and therefore it makes sense to always measure engine speed across two (or an even number) of revolutions.
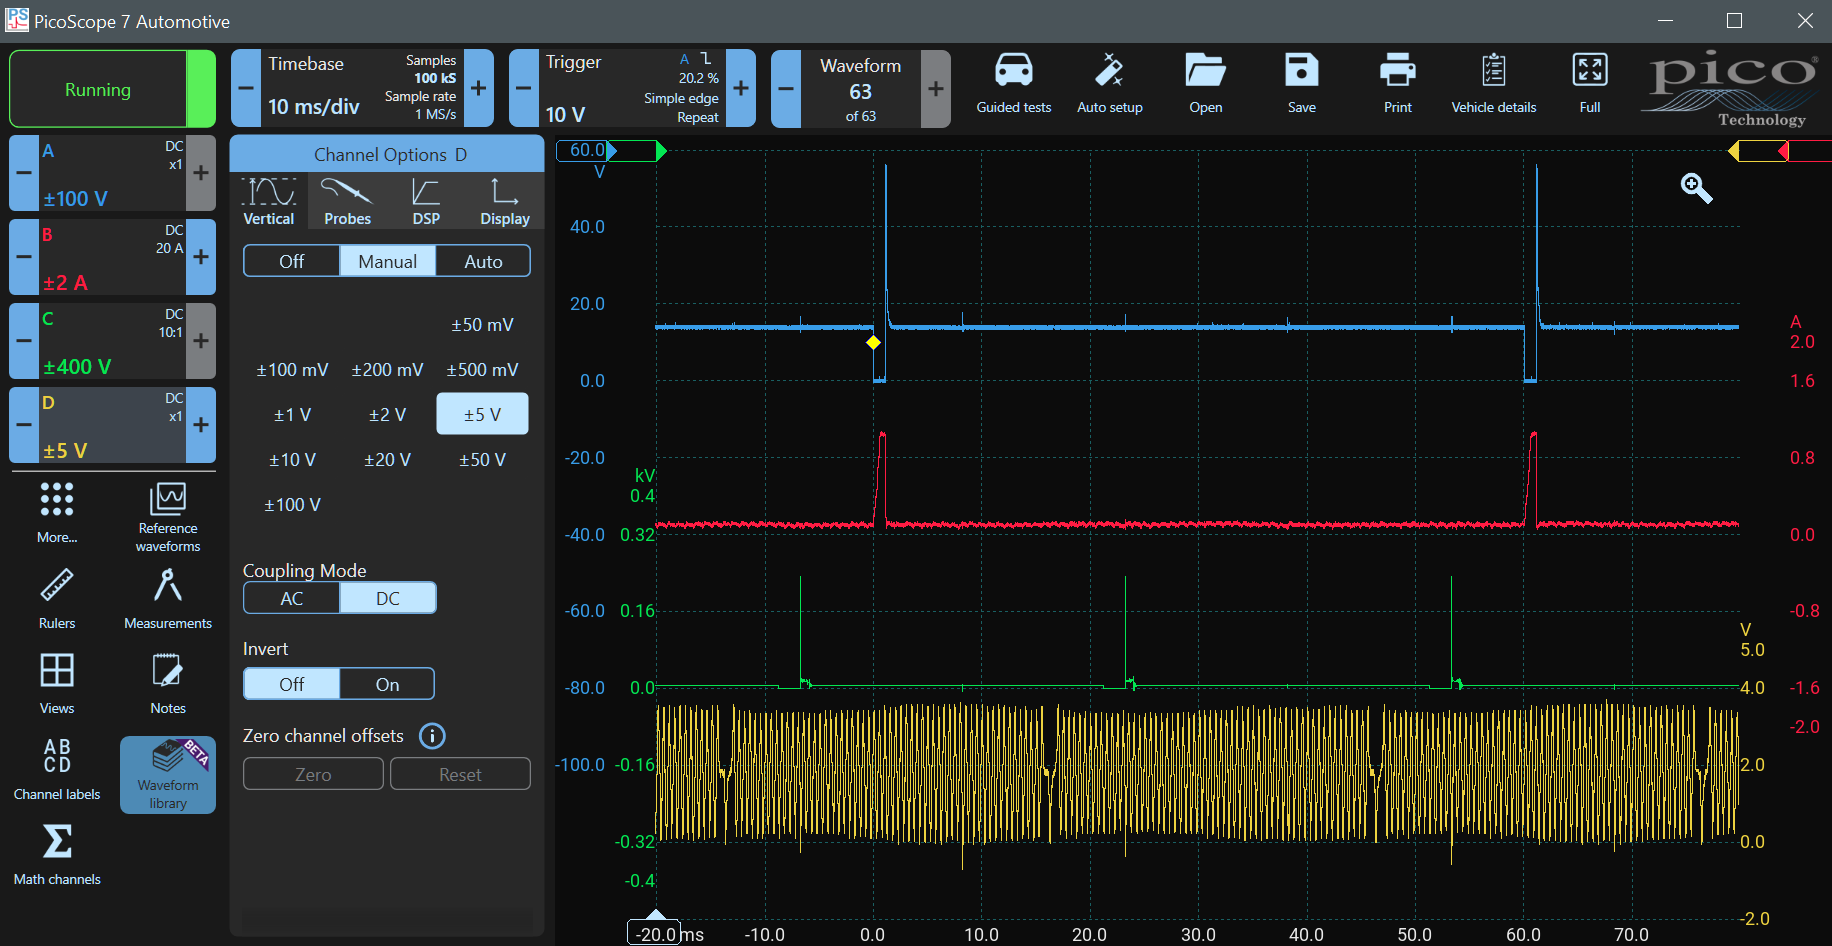
Using PicoScope Time Rulers to measure Engine Speed
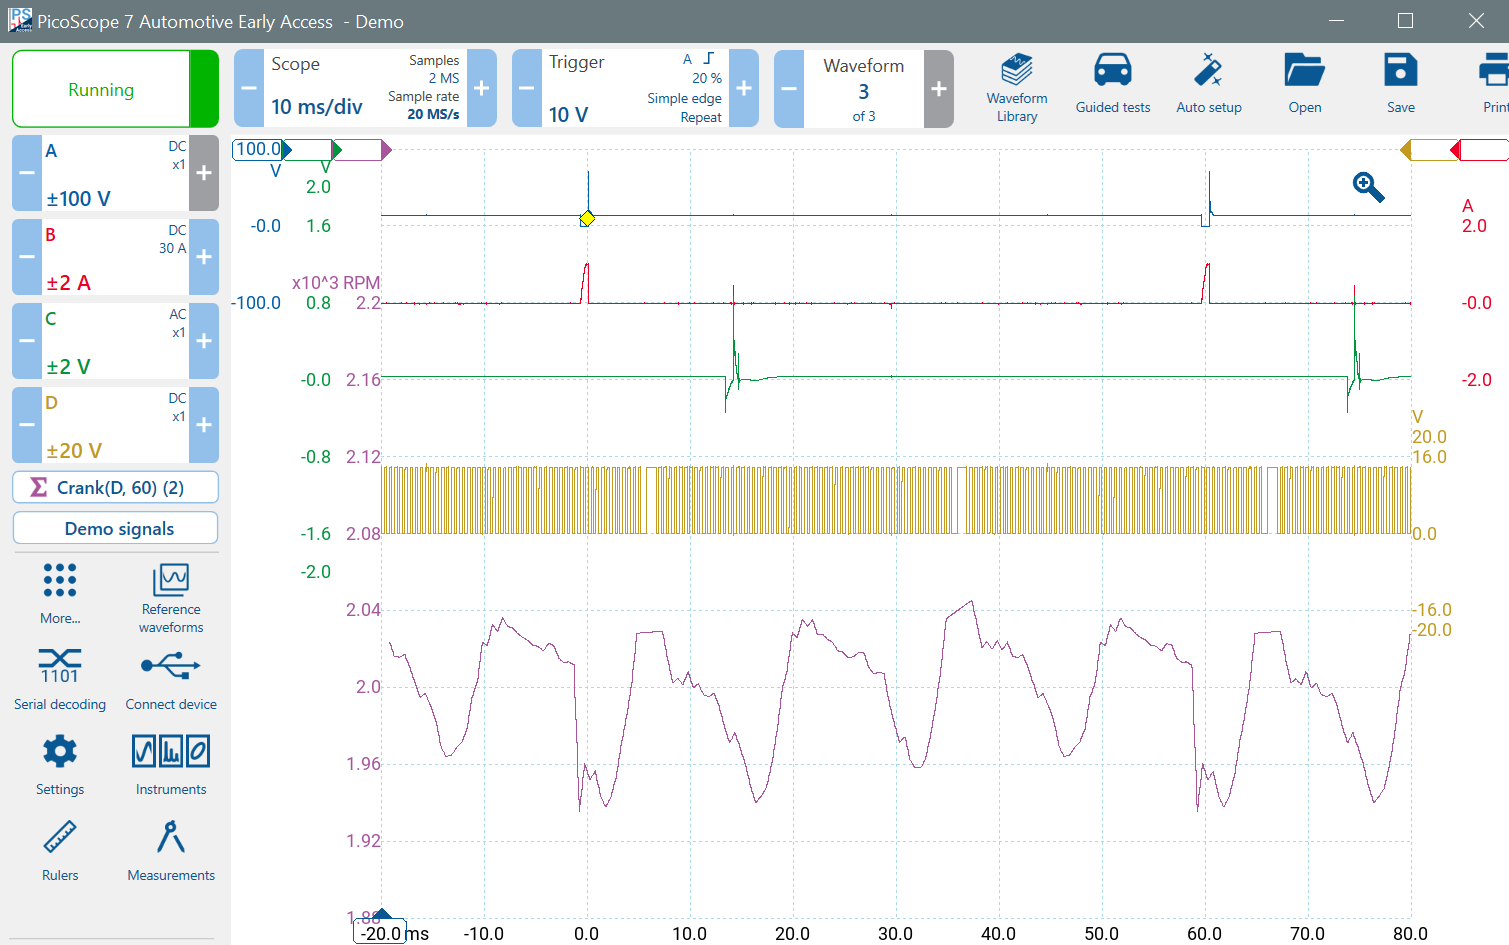
Drag out the time rulers (bottom left) so that they align with the first falling edge following the first and third gap. Remember to use Zoom to align the rulers accurately.
Sometimes when you zoom out again, the screen resolution might shift the rulers off the waveform edges. Don't worry about that, the zoomed position is correct. If you find that the waveform isn't stable, you can stop the scope to make the measurement.
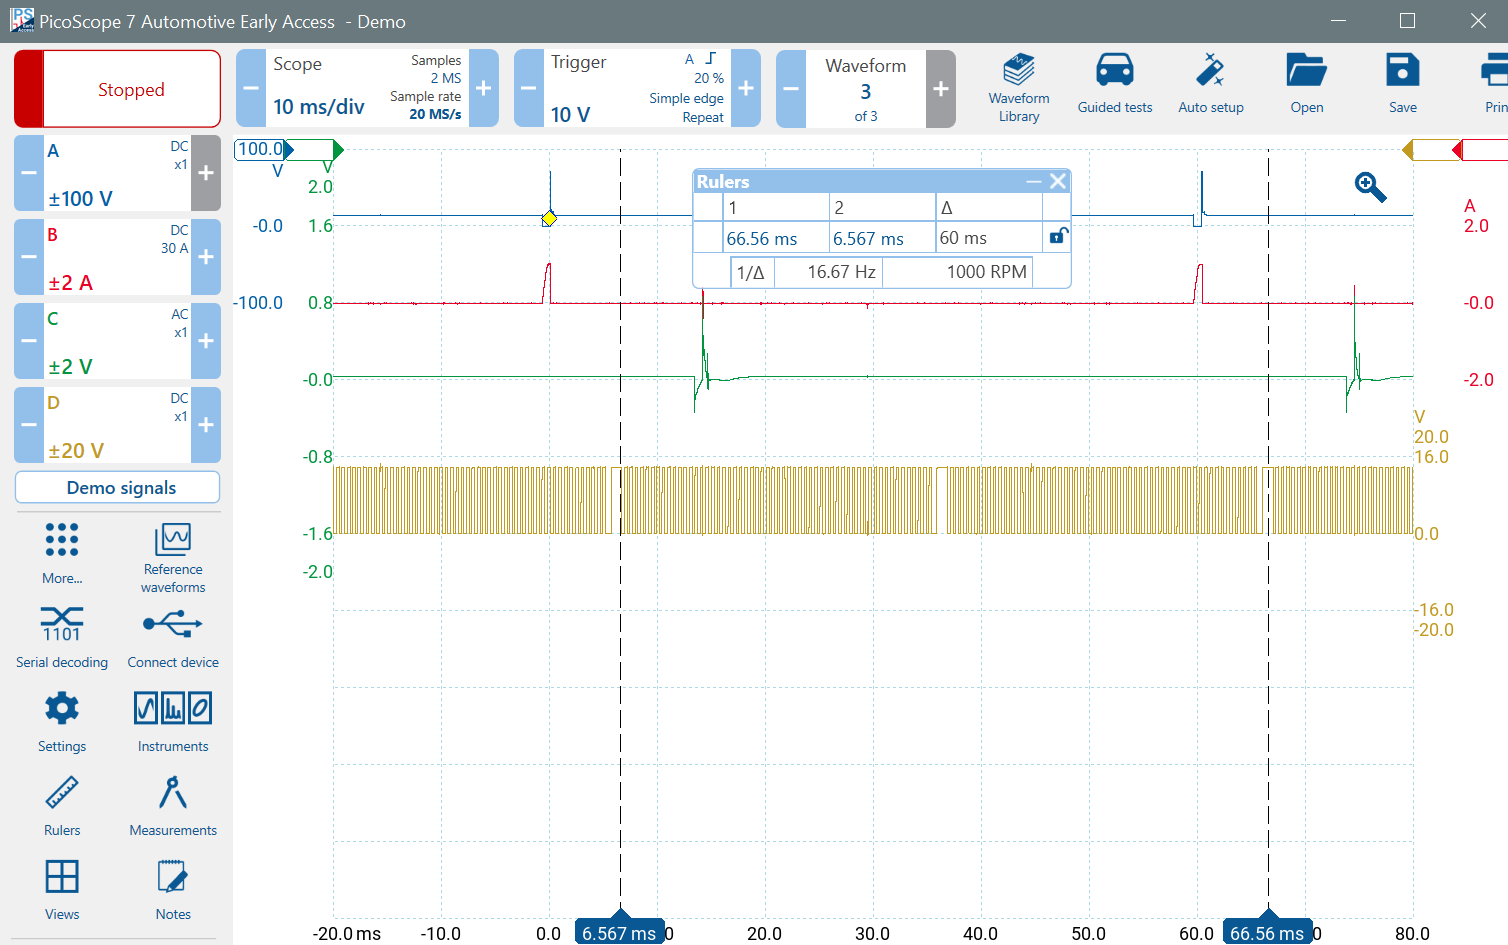
The displayed rotational speed is 1,000 RPM. As the rulers cover two revolutions, the actual engine speed is 2,000 RPM
Counting the Number of Teeth
You could zoom into one revolution and manually count the number of teeth, but PicoScope has many measurement functions that can help you accomplish this task more easily.
The rulers are currently set on the falling edge following the missing teeth gap encompassing two revolutions. Click on Measurements (or find the 'Measurements' Icon under the 'More...' Menu). Scroll down to the Time section, and you will see three Edge Count options.
- Edge Count counts both the rising and the falling edges
- As the names suggest, the Rising Edge Count counts only positive-going edges
- The Falling Edge Count counts only negative-going edges.
So which should we use?
- We shouldn't use Edge Count because each tooth will be counted twice.
- We shouldn't use Falling Edge Count because our rulers are on the falling edges, and therefore a sight mis-placement of the rulers might cause a count error.
- We should use the Rising Edge Count.
Click on Rising Edge Count, choose Channel D and select 'Between Rulers'.
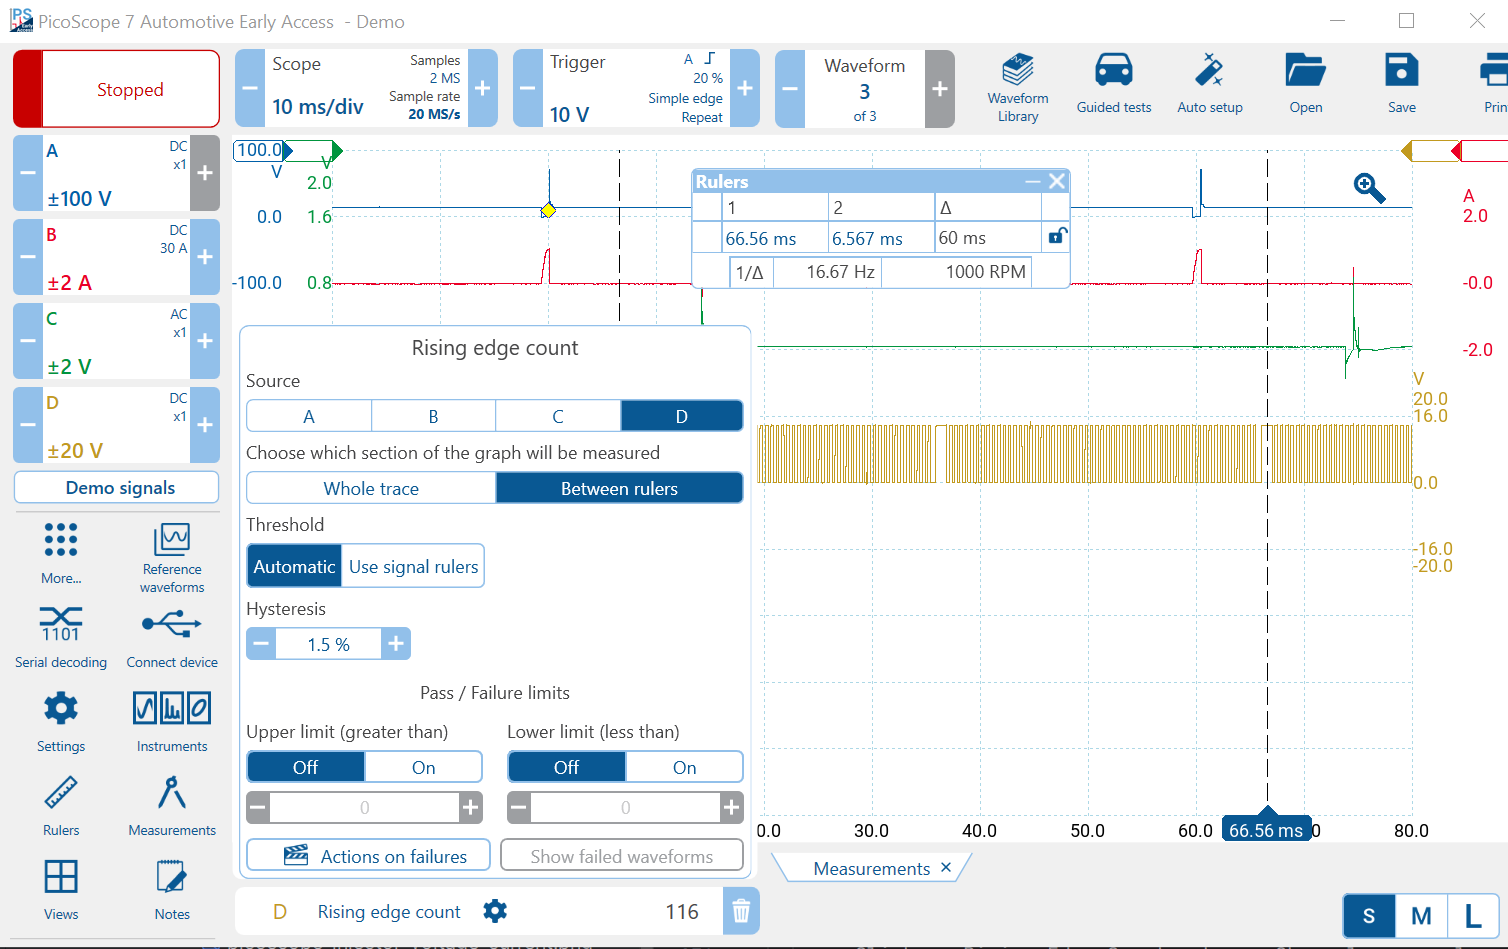
The number of edges (teeth) counted is 116 (bottom of the window). As the rulers encompass two revolutions, the actual number of teeth detected is 58. However, there are two teeth missing, so the total tooth count, including the missing teeth, is 60.
Graphing Engine Speed
The reason we need to determine the number of teeth and the overall engine speed is to allow us to use the Maths Crank() function that graphs engine speed. Seeing a graph of engine speed can help us accurately determine engine timing (TDC) and to find any under-performing or misfiring cylinders.
There are many ways to detect a misfire or an under-performing cylinder using PicoScope such as:
- Maths Channel Crank Function (the method described here)
- PicoDiagnostics Engine Balance Test
- NVH: look for a 0.5E vibration (one disturbance for every two engine rotations)
- WPS500X Exhaust Pulsations Test
Setting up the Maths Channel to measure Crank Speed
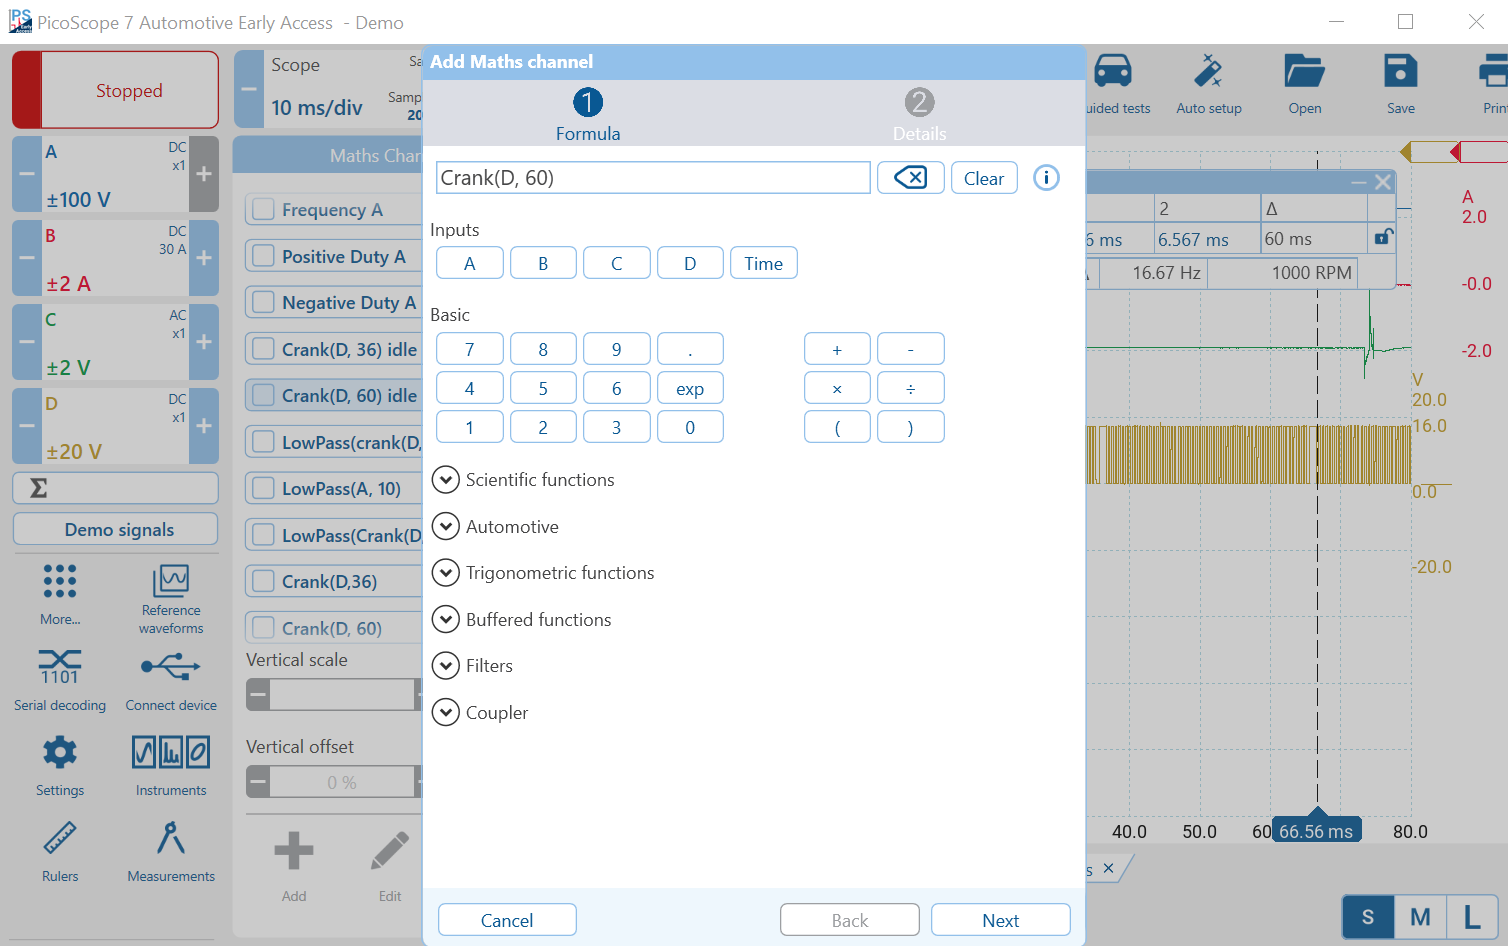
Click on the Maths Channels Icon or find it in the More... menu. Click Add (Plus Sign at the bottom) and type
this formula into the red text box:
Crank(D, 60)
D means Channel D, and 60 means the number of teeth, including the missing
teeth.
The text box red border will disappear when you type the formula correctly.
On some computers, the regional settings do not allow a comma and require a semicolon. If the red border
does not disappear, then try:
Crank(D; 60)
instead.
Click Next and choose a colour for your new waveform. I chose purple because it stands out, and it is different to the channel colours.
We measured the average engine speed and found it to be 2000 RPM. The engine speed will vary above and below that value. Choose a value above and below 2000 RPM that encompasses the expected variations in engine speed. I chose 1,800 RPM as the minimum speed and 2,200 RPM as the maximum Speed. Turn off SI Prefix before entering these values.
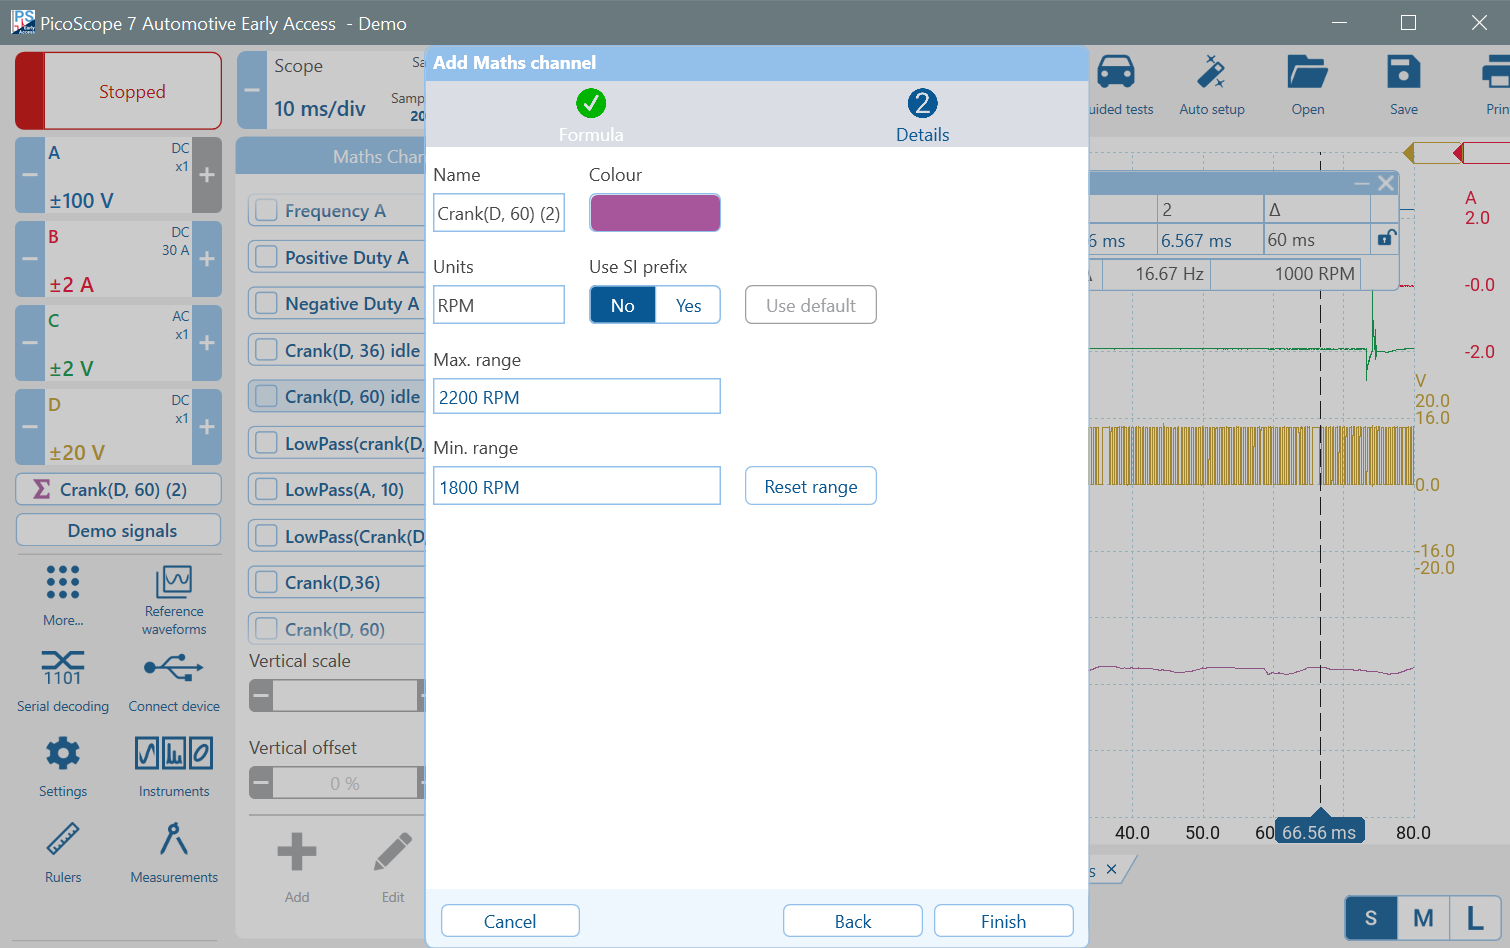
Click Finish, allow the scope to run, and your Crank (Engine) Speed will be displayed. Turn off the rulers and close the Rising Edge Count by clicking on the Bin Icon. Drag the RPM Scale down so that the engine speed does not overlap Channel D.
Filtering the Crank Speed Signal
The crank speed signal is rather jagged, and it is unlikely that the engine speeds up and slows down over the period of one tooth. PicoScope Maths Channel has many formulae and functions. One such function is LowPass which filters high frequencies from a signal. We will create a new Filtered Maths Channel to smooth out the engine speed.
Click Maths Channels again and then Add. Tpe the following formula:
LowPass(Crank(D, 60), 33) (Use the semicolon if necessary)
This means:
- Create a Crank Maths Channel on Channel D with 60 Teeth
- Low-Pass Filter the channel and reject frequencies above 33 Hz (2,000 RPM)
Move the new waveform down and enable the phase rulers. Place the left ruler on the lowest point just after the first ignition pulse and the right ruler on the lowest point just after the second ignition pulse.
That is a reasonably accurate estimation of TDC because the engine speed is at a minimum.
Zoom into the Injector Current Pulse and place a time ruler on the 'dimple' just before the maximum current. That is when the injector opened.
Use Rulers to measure Engine Timing Events
Zoom into the ignition pulse and place the other time ruler on the ionisation spike. That is when the spark starts.
Notice that because the phase rulers are deployed, the time rulers now display their position in terms of time, as before, and also in degrees, relative to the phase rulers.
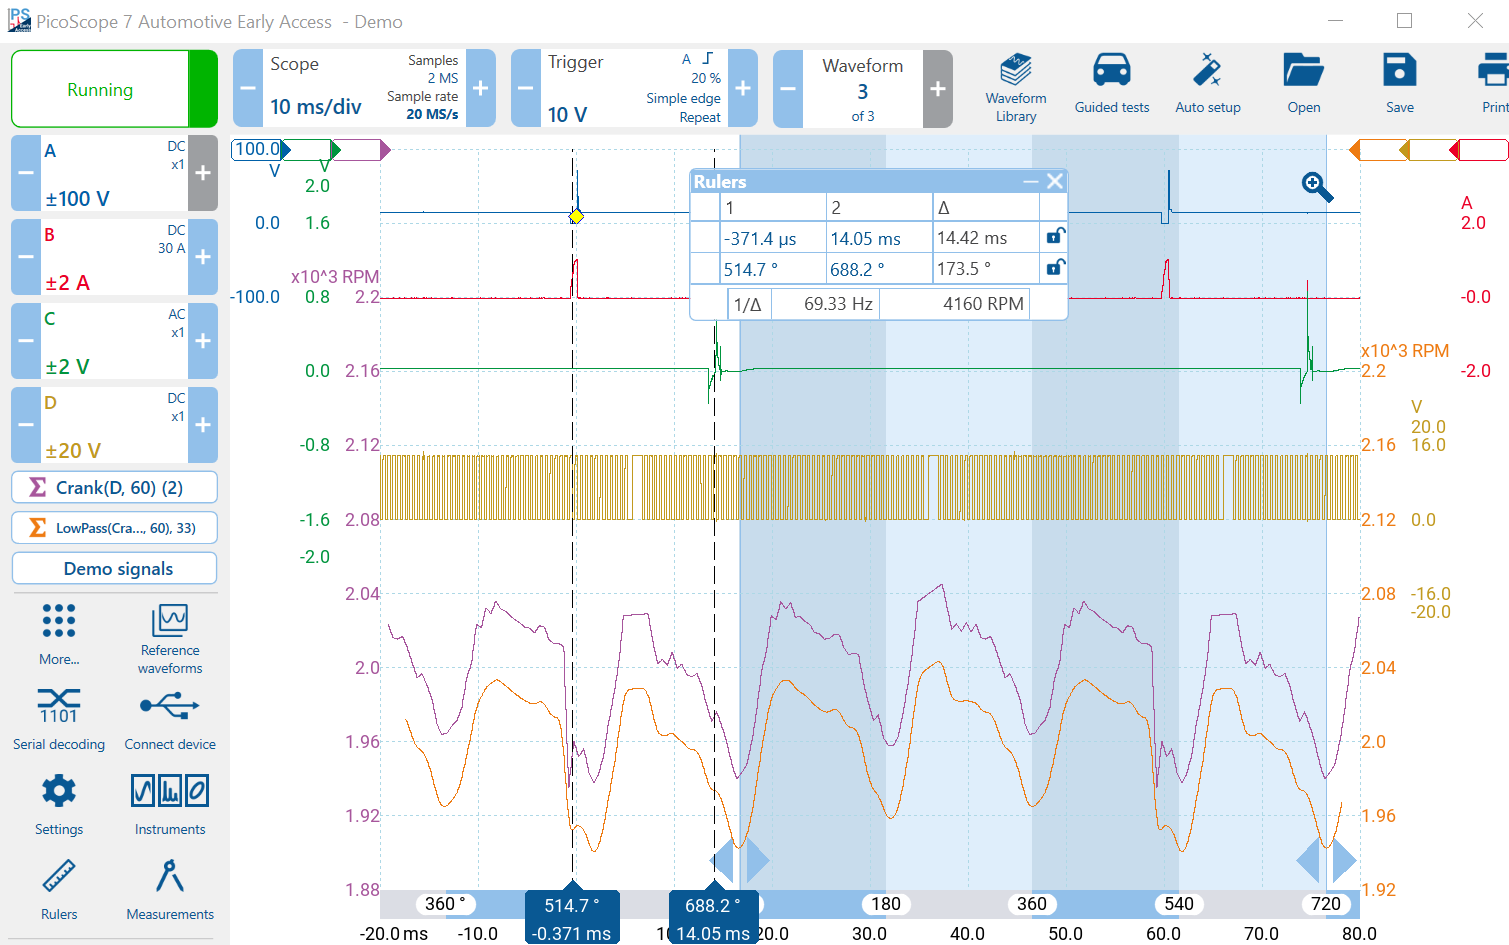
Now we can see a more accurate rendition of the 4-stroke cycle: Combustion, Exhaust, Inlet, and Compression.
Correcting wrong assumptions
We estimated that TDC was just after the ignition pulse previously. Now we have a graph of actual engine speed, we can estimate the position of TDC more accurately. TDC is where the engine speed is at a minimum.
Correction to Injection Timing
When we estimated where TDC was before, we thought that injection occurred during the compression cycle. Injection actually starts at 514.7 - 360 = 154.7 degrees into the inlet cycle, or 540 - 514.7 = 25.3 degrees before the end of the inlet cycle, not during the compression cycle. Even so, injection is rather later than expected!
Correction to Ignition Timing
Ignition is a puzzle, however, because the spark starts at 720 - 688.2 = 31.8 degrees before TDC! This is very advanced and will tend to impede the upward motion of the piston in the cylinder and increase the in-cylinder pressure at TDC.
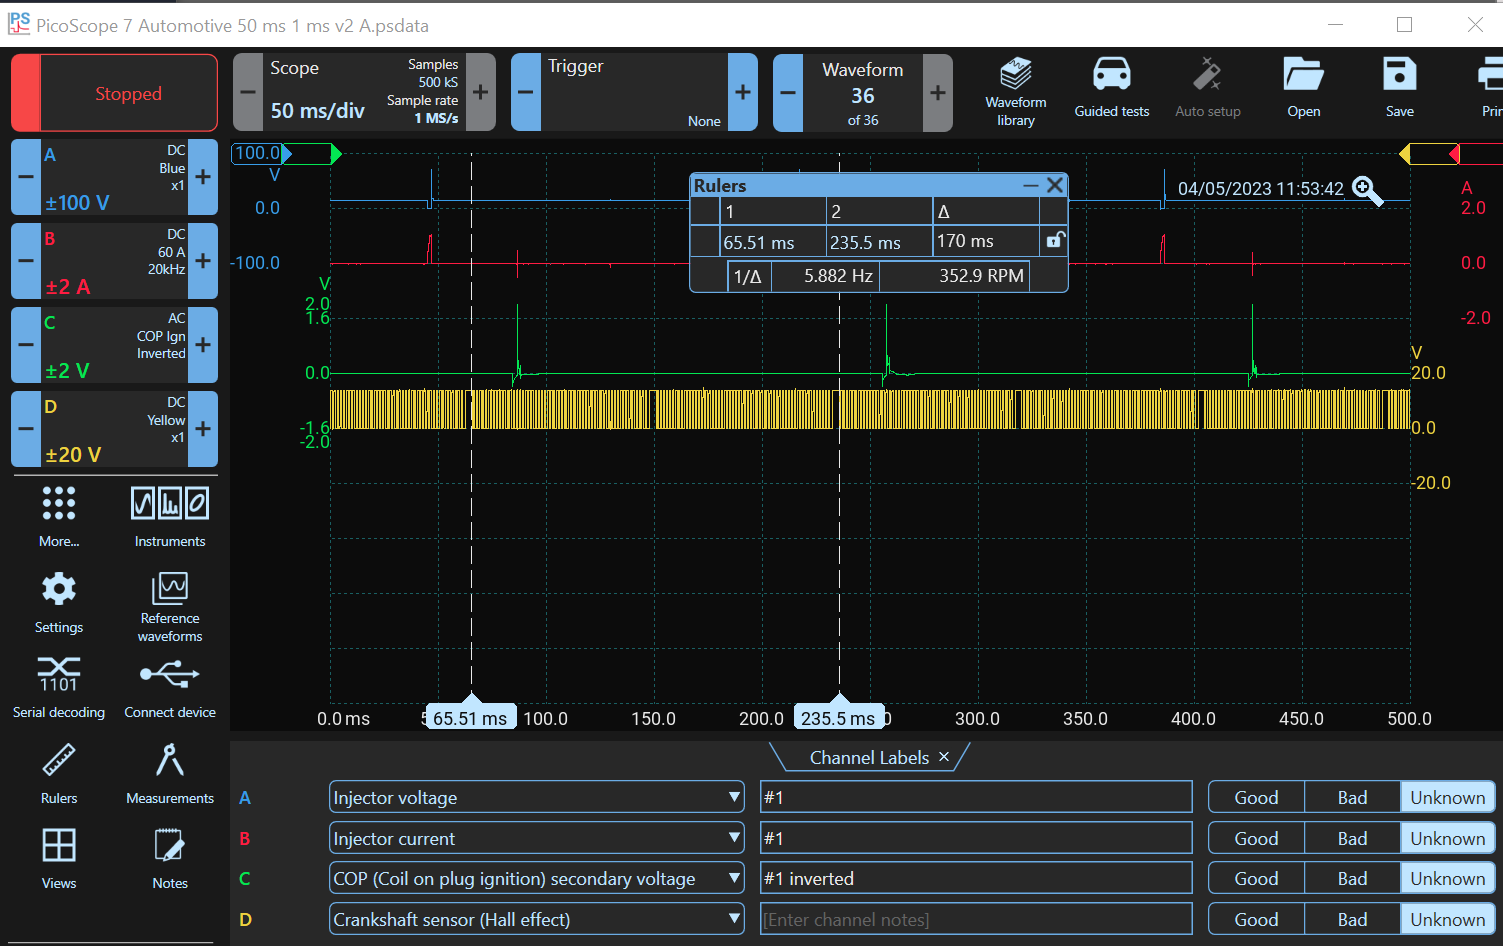
PicoScope Data File
The demo waveforms were not contrived but derived from a real vehicle. Steve Smith from Pico Technology has kindly provided both the original .psdata file from which the waveforms were created, and details about the vehicle.
It is a Mini Cooper Engine, specifically a Prince 1.6-litre engine with Port Injection and four Cylinders. The Engine Code is N12 B16A and was developed as a Joint Venture between BMW and Peugeot.
Download the PicoScope .psdata file Prince-N12-B16A.psdata. You can open it with PicoScope 7. You don't need a PicoScope, nor do you need Demo Mode.
Notice that the engine speed has been adjusted in the demo. You can change the engine speed in the demo setup. If you measure the engine speed (across two revolutions), you will see that the real engine was idling. Measured Value: 353 RPM, Engine Speed 706 RPM.
Next, we cover CAN bus testing in Demo Mode.